Carregar apresentação
A apresentação está carregando. Por favor, espere

1
Science, Technology and Innovation indicators: benchmarking R&D policies
An historical perspective The “Frascati Manual” and the “Oslo Manual” S&T indicators Innovation indicators Some evidence from innovation surveys Concluding remarks

2
C&T in OCDE: 63-95 1963 1995 DE NL BE PT GR IT IE US JP UK FR 2 4 6 8
2 4 6 8 10 12 14 0,5 1 1,5 2,5 3 3,5 1963 Staff in R&D / 1000 inhabitants % GNP applied in R&D DE NL BE PT GR IT IE US JP UK FR UE 2 4 6 8 10 12 14 0,5 1 1,5 2,5 3 3,5 DE NL UE BE PT GR IT IE US JP UK FR 2 4 6 8 10 12 14 0,5 1 1,5 2,5 3 3,5 1995

3
S&T indicators: evolving from basic indicatores...
Which effects to be considered??? Output, impact, efficiency: output/input ... The need for: terms of reference a model of analysis Other effects: how to consider the “context”?? Time Scale: scale/intensity Structure Space .....

6
Definition of research and development (Frascati Manual)
R&D is defined as creative work undertaken on a systematic basis in order to increase the stock of knowledge including knowledge of man, culture and society, and the use of this stock of knowledge to devise new applications.

7
The linear model Research-based Sequential Tecnocratic

8
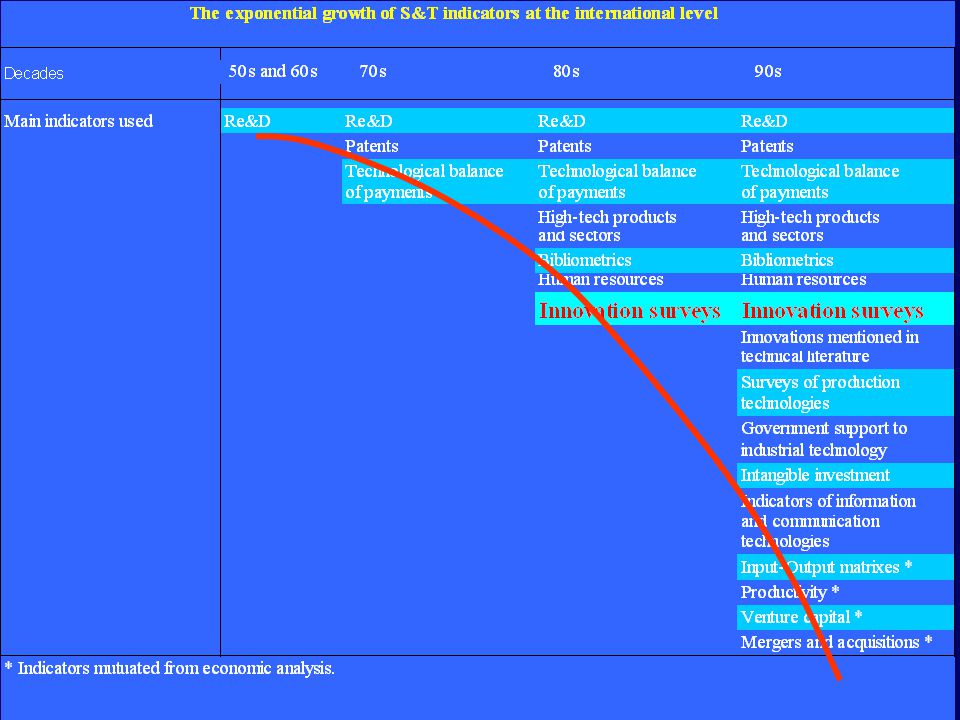
Development of indicators

9
“The Chain Link Model” Research Knowledge “Communities of practice”
Potential Markets Invention/ analytical design Detailed design & Test Re-design & Production Distribution & market Knowledge Research Technology platforms BUS Kline & Rosenberg (1986)
")
11
Technological innovation (Oslo Manual)
Technological innovations comprise new products and processes and significant technological changes of products, services and processes. An innovation has been implemented if it has been introduced on the market (product and service innovation) or used within a production process (process innovation).
 or used within a production process (process innovation).")
12
Technological innovation (Oslo Manual)
Innovations involve a series of scientific, technological, organisational, financial and commercial activities. The product or process should be new (or rignificantly improved) to the firm (it does not necessarily have to be new to the relevant market)
 to the firm (it does not necessarily have to be new to the relevant market)")
13
Science and technology indicators
Human resources for S&T R&D Patents Bibliometrics Technological balance of payments Trade in high-tech products

14
Permilagem de investigadores (ETI) pela população activa, para o último ano disponível
Notas: FIN, JP, E, P: 2000; Uk, A: 1998; EUA: 1997; Todos os outros países: Média da UE não inclui o Luxemburgo Fonte: European Commission, Key Figures 2002 – Science, Technology and Innovation

15
Novos doutorados em ciência e tecnologia por permilagem de população entre os 25 e os 34 anos, para o último ano disponível Notas: I, UE: 1999; todos os outros países referem-se a 2000; A média da UE não inclui o Luxemburgo; Os dados da Espanha são provisionais. Fonte: European Commission, Key Figures 2002 – Science, Technology and Innovation

16
Scale vs Intensity in R&D
The effect of scale: Scale vs Intensity in R&D

17
Scale vs Intensity in R&D
(OECD, 2000)
")
18
Dynamic effects to complement static data
The effect of time: Dynamic effects to complement static data

19
Crescimento médio anual dos investigadores pela população activa, para o último ano disponível
Notas: FIN, JP, E, P: 2000; UK, A: 1998; EUA: 1997; Todos os outros países: Média da UE não inclui o Luxemburgo e a Áustria. Fonte: European Commission, Key Figures 2002 – Science, Technology and Innovation

20
Notas: I, UE: 1998-1999. A média da UE não inclui o Luxemburgo
Crescimento de Novos doutorados por permilagem de população, entre os 25 e os 34 anos, entre 1999 e 2000 Notas: I, UE: A média da UE não inclui o Luxemburgo Fonte: European Commission, Key Figures 2002 – Science, Technology and Innovation

21
A média da UE não inclui o Luxemburgo
GERD: Notas: B, DK, EL, IRL, I, NL, S: ; JP: ; Todos os outros países e UE: A média da UE não inclui o Luxemburgo Fonte: European Commission, Key Figures 2002 – Science, Technology and Innovation

22
Conceição, Heitor and Oliveira(2001)
The historical evidence: intensity of R&D support in US Conceição, Heitor and Oliveira(2001) Private Federal
 Private. Federal.")
23
Conceição, Heitor and Oliveira(2001)
The historical evidence: cumulative R&D support in US Conceição, Heitor and Oliveira(2001) Federal Private
 Federal. Private.")
24
Perspectives for “change”:
Public vs private R&D expenditures 0,025 0,05 0,075 0,1 0,125 0,25 0,375 0,5 Public R&D Expenditures per capita Private R&D Expenditures per capita Canada Denmark Finland France Germany Ireland Japan Netherlands Norway Portugal Spain Sweden UK US Belgium Czech Rep Hungary Korea Mexico New Zealand Poland Turkey FR D JP USA UK P97 P95 ES SE IR P81

25
characterizing structure:
Public and private funding of R&D

26
BERD / GERD With the exception of the less developed OECD countries, business expenditure on R&D accounts for the majority of total expenditure, and has an overwhelming share (close or above ¾) in the most developed countries
 in the most developed countries.")
27
Share of R&D funding (OECD) OECD, S&T Databases, Sept. 2001
Industry-dominated systems Balanced Industry+ /government systems Balanced Industry/government+ systems Government-dominated systems

28
Share of R&D expenditure (OECD) OECD, S&T Databases, Sept. 2001
Industry-dominated systems Balanced industry/government systems with universities being more important performers than public research institutions Balanced industry/government systems with public research institutions being more important performers than universities Government-dominated systems

29
Share of R&D funding and expenditure (OECD) OECD, S&T Databases, Sept
USA Irland Netherlands Spain Hungary Portugal

30
Variation of BERD: Notas: JP: ; A, D, E, P, FIN, EUA: ; Todos os outros países e UE: Fonte: European Commission, Key Figures 2002 – Science, Technology and Innovation

31
Comparative growth in public and total R&D expenditures (average annual growth rates over , or nearest years available)
")
32
Growth of Public and Private expenditure on R&D
OECD, S&T databases, October 2001

33
Percentagem de PMEs que executam I&D no sector privado com financiamento público, no último ano disponível Notas: JP, I, E, FIN, P:2000; A: 1998; IRL: 1997; Todos os outros países e UE: 1999; A média Europeia não inclui a Bélgica, Luxemburgo e Suécia; Os dados da Irlanda só se referem a PMEs independentes. Fonte: European Commission, Key Figures 2002 – Science, Technology and Innovation

34
Crescimento médio anual da percentagem de PMEs que executam I&D no sector privado com financiamento público, de 1995 até ao último ano disponível Notas: JP, I, Fin, P: ;E: ; IRL: ; D, DK, UE, EUA: ; Todos os outros países: ; A média da UE não inclui a Bélgica, Espanha, Irlanda, Luxemburgo, Áustria e Suécia. Fonte: European Commission, Key Figures 2002 – Science, Technology and Innovation

35
Characterizing efficiency:
Scientific Production Technological capacity ...

36
Absolute R&D Expenditures and Scientific Production (1997). OECD (2000)
. OECD (2000)")
37
Technological Capacity ( PATENTS / GDP) 1996
> 200 < 15 Média UE = 100 Source: OST, 1998

38
Scientific Capacity (PUBLICATIONS / GNP) 1996
> 200 < 15 Média UE = 100 Source: OST, 1998

39
Technological Capacity
source: Caracostas & Muldur (1998)
")
40
Scientific “Productivity” and inter-institutional cooperation
EC Benchmark of S&T Policies, September 2001

41
What would we like to know?
Innovation : What do we know? What would we like to know?

42
The Imperative: improve productivity and efficiency, not the extension with which resources are used
Contributions of Hourly Productivity and of Hours Worked to the “Gap” in GDP per Capita (1998)
")
43
How to increase productivity? There is a need to enhance innovation.
Why? Because Portugal is already competitive in low value-added activities. Proportion of Exports According to the Price/Quality Ratio (Value) of Exported Goods (EUROSTAT)
 of Exported Goods (EUROSTAT)")
44
What is lacking to enhance productivity?
a) R&D investment, namely by firms High Tech Exports and R&D Intensity in Firms (OCDE,2002)
 R&D investment, namely by firms. High Tech Exports and R&D Intensity in Firms (OCDE,2002)")
45
What is lacking to enhance productivity?
b) expenditure on innovation Firm Revenues Invested in Activities Oriented towards Innovation
 expenditure on innovation. Firm Revenues Invested in Activities Oriented towards Innovation.")
46
c) Portugal also lacks technical skills and competencies
What is lacking to enhance productivity? c) Portugal also lacks technical skills and competencies
 Portugal also lacks technical skills and competencies.")
47
What is lacking to enhance productivity?
d) Portugal is behind in organizational, as much as in technological, innovation Adoption of Flexible Management Practices OCDE (1999). Employment Outlook
 Portugal is behind in organizational, as much as in technological, innovation. Adoption of Flexible Management Practices. OCDE (1999). Employment Outlook.")
48
Market Regulation and Employment Protection
What is lacking to enhance productivity? Market Regulation and Employment Protection Nicoletti, Scarpetta & Boylaud; OECD (2000)
")
49
What does Portugal have going for it?
a) Portugal is now a dual country: excellence coexists with poor performance Written Literacy: Results for Population between 20 and 25 Years with Advanced High School Diplomas Literacy: Results for the Entire Population
 Portugal is now a dual country: excellence coexists with poor performance. Written Literacy: Results for Population between 20 and 25 Years with Advanced High School Diplomas. Literacy: Results for the Entire Population.")
50
What does Portugal have going for it?
b) Portugal has been growing fast, but less so than other “catching-up” countries Variation in the Number of Patents and Number of Published Scientific Articles
 Portugal has been growing fast, but less so than other catching-up countries. Variation in the Number of Patents and Number of Published Scientific Articles.")
51
What does Portugal have going for it?
c) Portugal has a new wealth in incoming people Growth in the Population of Each Country with Foreign Origin ( ), OECD(2000)
 Portugal has a new wealth in incoming people. Growth in the Population of Each Country with Foreign Origin ( ), OECD(2000)")
52
Average Annual Real Value Added Growth of knowledge Based Industries
OECD(2000) UK* Belgium Portugal** Greece* Sweden*** NL* Austria Japan Norway Canada Denmark Spain*** Mexico Italy US France Korea Germany 2 4 6 8 10 12 14 20 30 40 50 60 Share in Business Sector Value Added of Knowledge Based Industries (share year 1996 except: *1995;**1993; ***1994) of Knowledge Based Industries (1985-share year) Average Annual Real Value Added Growth
 UK* Belgium. Portugal** Greece* Sweden*** NL* Austria. Japan. Norway. Canada. Denmark. Spain*** Mexico. Italy. US. France. Korea. Germany Share in Business Sector Value Added of Knowledge Based Industries. (share year 1996 except: *1995;**1993; ***1994) of Knowledge Based Industries (1985-share year) Average Annual Real Value Added Growth.")
53
Balanço tecnológico de pagamentos como percentagem do PIB, para o ano mais recente
Notas: E, FIN: 1998; F, EUA:1999; Todos os outros países: Fonte: European Commission, Key Figures 2002 – Science, Technology and Innovation

54
Crescimento médio anual das receitas da balança de pagamentos em tecnologia para os anos mais recentes Notas: Valores calculados em PPS a preços de 1995; E, FIN: ; EUA, F: ; P, UK: ; Todos os outros países: Fonte: European Commission, Key Figures 2002 – Science, Technology and Innovation

55
In the way of a summary Portugal needs to jump from a “catching-up” model of economic growth and development, to a model of “forging-ahead” by exploring creativity and ingeniousness by developing and diffusing innovation. There may be agreement on some general and generic areas for investment (education, science and technology, infrastructures, “social capital” defined in a broad way). But the design and implementation of specific policies meets two challenges: The lack of understanding of the barriers and opportunities A lack of qualified people able to understand and interpret the developmental shortcomings of the country and of designing and implementing, at the firm level or in the public sector, the measures that could overcome these shortcomings.
. But the design and implementation of specific policies meets two challenges: The lack of understanding of the barriers and opportunities. A lack of qualified people able to understand and interpret the developmental shortcomings of the country and of designing and implementing, at the firm level or in the public sector, the measures that could overcome these shortcomings.")
56
Main indicators from innovation surveys
Number of innovating firms by sector by firm size Cost of innovation Percentage of sales due to new products The Community Innovation Survey, CIS

57
The Community Innovation Survey (CIS) The harmonised EU/OECD questionnaire
General information about the firm Type of innovation (product, process) Sources of information for innovation Objectives of innovation Factors hampering innovation Cost of innovation Impact of innovation
 Sources of information for innovation. Objectives of innovation. Factors hampering innovation. Cost of innovation. Impact of innovation.")
58
Survey Target Population
The Third Community innovation Survey: CIS 3 Application to Portugal Survey Target Population All Manufacturing and Service firms with more than 10 employees Survey Sample Initial Sample: 4727 firms stratified by firm size and sector (INE–1999 Data) Corrected sample: 4127 firms Sectors Surveyed Mining and Quarrying, all Manufacturing, Utilities, Wholesale Trade and a selection of industries in the Service Sector Innovation Defined as: Market introduction of a product (Good or Service) new or significantly improved, or the introduction of new or significantly improved processes, based on new technological developments, new combinations of existing technologies or on the use of other type of knowledge acquired.
 Corrected sample: 4127 firms. Sectors Surveyed. Mining and Quarrying, all Manufacturing, Utilities, Wholesale Trade and a selection of industries in the Service Sector. Innovation Defined as: Market introduction of a product (Good or Service) new or significantly improved, or the introduction of new or significantly improved processes, based on new technological developments, new combinations of existing technologies or on the use of other type of knowledge acquired.")
59
The Third Community innovation Survey
Questionnaire Harmonized questionnaire (the same for Services and Manufacturing and other industries) Questions regarding: General Information Basic Economic Information Product and Process Innovation Patents and Other Protection Methods Innovation Activities and Expenditure Intramural R & D Other Strategic and Organizational Important Changes Effects of Innovation Public Funding Innovation Co-operation Sources of Information for Innovation Hampered Innovation Activity Companies Characteristics Innovation Extension Companies Options Systemic Characteristics
 Questions regarding: General Information. Basic Economic Information. Product and Process Innovation. Patents and Other Protection Methods. Innovation Activities and Expenditure. Intramural R & D. Other Strategic and Organizational Important Changes. Effects of Innovation. Public Funding. Innovation Co-operation. Sources of Information for Innovation. Hampered Innovation Activity. Companies Characteristics. Innovation Extension. Companies Options. Systemic Characteristics.")
60
Convergence Leading the Convergence towards the EU Mean 100% 80% 60%
Proportion of Service Innovating Enterprises Ireland 60% For comparison with the data of some Sub sectors (NACE 63, 73, 74.3 e 64 except 64.2) and the manufacturing companies in between 10 and 20 employees which were part of the CIS 3 survey are not considered (2) Includes the results not considered in (1). Note: Final disaggregated and comparable results are not yet available for the other participants in the exercise. (1) (2) CIS III (Preliminary) Austria Luxemburg Germany UK CIS II 40% France Netherlands Portugal Sweden Italy Finland Norway 20% Belgium 0% 20% 40% 60% 80% 100% Proportion of Manufacturing Innovating Enterprises
 and the manufacturing companies in between 10 and 20 employees which were part of the CIS 3 survey are not considered. (2) Includes the results not considered in (1). Note: Final disaggregated and comparable results are not yet available for the other participants in the exercise. (1) (2) CIS III. (Preliminary) Austria. Luxemburg. Germany. UK. CIS II. 40% France. Netherlands. Portugal. Sweden. Italy. Finland. Norway. 20% Belgium. 0% 20% 40% 60% 80% 100% Proportion of Manufacturing Innovating Enterprises.")
61
Convergence: Input vs Output
Manufacturing Sector 80% Ireland Germany Austria Netherlands 60% UK Sweden Norway France Porportion of Innovative Enterprises CIS III (Preliminary) CIS II 40% Finland Belgium Portugal 20% 0% 0.0% 2.0% 4.0% 6.0% 8.0% Expenditure in Innovating Activities as Share of Turnover
 CIS II. 40% Finland. Belgium. Portugal. 20% 0% 0.0% 2.0% 4.0% 6.0% 8.0% Expenditure in Innovating Activities as Share of Turnover.")
62
Questions to be raised:
Purely quantitative vs. qualitative convergence Questions to be raised: Do results indicate latecomer growth? Do qualitative weaknesses remain? Or Is there evidence of qualitative changes as well?

63
Evidence Supporting Qualitative Change
ME’s Catching Up

64
Note: Less confined to the Technologically advanced sectors
Evidence Supporting Qualitative Change Innovation pervades the economy Note: Less confined to the Technologically advanced sectors

65
Evidence Supporting Qualitative Change
Shift of innovation expenditure toward intangibles: services sector However, weak and ambiguous in the manufacturing firms - decrease in marketing & training, rise in R&D…

66
(Source: R&D Survey, IPCTN, 2002)
Evidence Supporting Qualitative Change … consistent with the rise of BERD since 1997, still quite low by EU standards… (Source: R&D Survey, IPCTN, 2002)
")
67
Evidence Supporting Qualitative Change
… and with the observed correlation between technological and other innovations

68
Evidence Supporting persistent structural weaknesses
Industrial structure skewed to very small and small enterprises...

69
Evidence Supporting persistent structural weaknesses
… which are much less prone to innovate…

70
Evidence Supporting persistent structural weaknesses
… and to middle-low and low technology sectors…

71
Evidence Supporting persistent structural weaknesses
… also less innovative

72
Evidence Supporting persistent structural weaknesses
Limited market scope The restriction of most firms' targets to the national and local markets sets lower innovative challenges; It also accounts for the unusually high percentage of products "new to the market“, especially of services

73
Evidence Supporting persistent structural weaknesses
Protection Methods Protection of innovation, though mainly developed in house and new to the market, relies heavily on informal procedures (secrecy, complexity of design, time-to-market) This also helps to explain the persistence of a low use of formal IPR (patents, registration of design patterns, copyright): The only exception is trademarks.
 This also helps to explain the persistence of a low use of formal IPR (patents, registration of design patterns, copyright): The only exception is trademarks.")
74
Evidence Supporting persistent structural weaknesses
The relatively low academic qualification of the labor force persists, especially in the manufacturing sector This is all the more important as there is a significant difference in qualification between innovative and non-innovative firms

75
Evidence Supporting persistent structural weaknesses
As in CIS II, firms' perception of the obstacles hindering innovation contrasts with that of EU

76
Evidence Supporting persistent structural weaknesses
Firms overemphasize obstacles beyond their control (finance, costs, risk) and underemphasize those they can influence. Firms tend not to consider, and even less than in CIS II, organizational rigidities and lack of qualified personnel as barriers. But both qualification of personnel and organizational change are in fact associated to innovative firms, and Portugal has comparatively under-qualified workforce
 and underemphasize those they can influence. Firms tend not to consider, and even less than in CIS II, organizational rigidities and lack of qualified personnel as barriers. But both qualification of personnel and organizational change are in fact associated to innovative firms, and Portugal has comparatively under-qualified workforce.")
77
Innovation: What do we know?
The innovative performance of Portuguese firms has improved over the second half of the 1990s, as far as one can learn from self-reported indicators. The enhancement in innovative performance has been accompanied by limited, but significant, structural changes – that is, the improvement in performance goes beyond catching-up dynamics. Important structural weaknesses remain – both associated with factors external to the firms and with firm behavior, with firms attributing more importance to the former when asked to indicate barriers to innovation Technological innovation appears to be strongly correlated with Organizational Innovation and Change - there may be limited value-added and returns in looking at technological or organizational innovation per se.

78
Innovation: What would we like to know?
What would the characterization of innovation in Portugal would be like based, instead of self-reported indicators, on “independent” assessments? More specifically, what should we learn, compare, typify and seek to explain about innovative processes as a whole? What has the impact of policies been on the innovation performance of firms? When has it been positive, negative, redundant (that is, crowding-out what firms would do anyway as a response to changing market dynamics). What explains the correlation between technological and other types of innovation? What are the organizational adjustment and learning costs to innovation and how can they be minimized? Which are the organizational opportunities and how can they be optimized?
. What explains the correlation between technological and other types of innovation What are the organizational adjustment and learning costs to innovation and how can they be minimized Which are the organizational opportunities and how can they be optimized")
79
Innovation: What would we like to know?
What is generic, and what is specific, to the (still weak) innovative performance of the Portuguese firms? From what we would know to be generic, which lessons from other contexts could we apply in Portugal? From the specificity, what would constitute adequate responses? How important is innovation to enhance the welfare of Portugal? What alternatives to “becoming more innovative” would be available to meet the challenge of reaching the European average economic performance?
 innovative performance of the Portuguese firms From what we would know to be generic, which lessons from other contexts could we apply in Portugal From the specificity, what would constitute adequate responses How important is innovation to enhance the welfare of Portugal What alternatives to becoming more innovative would be available to meet the challenge of reaching the European average economic performance")
Apresentações semelhantes


 – Universidade Federal de Campina Grande (UFCG)EELA Grid School – December 04, 2006 Enhancing SegHidro/BRAMS.>")


 Rector of University.>")


 SEGUNDO NOVOS ESTRATOS VITÓRIA, ES – OUTUBRO 2008 Kenneth Camargo – IMS/UERJ Cláudia Medina – IESC/UFRJ.>")

