Carregar apresentação
A apresentação está carregando. Por favor, espere

1
Do AR4 ao AR5 - o caminho percorrido Pedro Leite da Silva Dias (*) Laboratório Nacional de Computação Científica/MCTI Instituto de Astronomia, Geofísica e Ciêncas Atmosféricas/USP Seminário: MUDANÇAS CLIMÁTICAS: IMPACTOS, VULNERABILIDADE E ADAPTAÇÃO INCLINE/IEE e CEPA/PRCEU, São Paulo 24 de abril de 2014
 Laboratório Nacional de Computação Científica/MCTI Instituto de Astronomia, Geofísica e Ciêncas Atmosféricas/USP Seminário: MUDANÇAS CLIMÁTICAS: IMPACTOS, VULNERABILIDADE E ADAPTAÇÃO INCLINE/IEE e CEPA/PRCEU, São Paulo 24 de abril de 2014")
2
O sistema terrestre: acoplamento entre a física, biogeoquímica e a forçante humana

3
atmosfera oceano+hidrologia + gelo solo vegetação Gases traço Modelagem do Sistema Climático Terrestre

4
Modelos no AR5 têm complexidade inédita: Efeito do derretimento do permafrost Fertilização da biota pelo CO2 Disponibilidade de nutrientes Ciclo biogeoquímico de gases traço Aerossois e nuvens Interação das correntes oceânicas com o gelo… Cenários econômicos interativos… Modelos no AR5 têm complexidade inédita: Efeito do derretimento do permafrost Fertilização da biota pelo CO2 Disponibilidade de nutrientes Ciclo biogeoquímico de gases traço Aerossois e nuvens Interação das correntes oceânicas com o gelo… Cenários econômicos interativos…

6
The Arctic Ocean is now projected to be ice-free during the summer by mid-century under a high emissions scenario, instead of the end of century as in previous reports. Highlights of the AR5 The conclusion that much of the warming over the past 50 years is due to human activities is now “extremely likely,” upgraded from “very likely” in the last report. Estimates of future sea level rise have been significantly increased due to a better understanding of the movement of ice sheets in a warming climate.

7
Each IPCC report has been progressively stronger in attributing climate change to human activities.progressively stronger The AR5 contains the strongest statement yet, saying it is “extremely likely” (a greater than 95 percent chance) that human activities are “the dominant cause of the observed warming” since the 1950s. The Third Assessment (2001) made a similar statement with approximately 66 percent certainty, while the Fourth Assessment Report (AR4) (2007) found that “most of the observed increase in global average temperatures since the mid-20th century is very likely (greater than 90 percent chance) due to the observed increase in anthropogenic greenhouse gas concentrations.” Each IPCC report has been progressively stronger in attributing climate change to human activities.progressively stronger The AR5 contains the strongest statement yet, saying it is “extremely likely” (a greater than 95 percent chance) that human activities are “the dominant cause of the observed warming” since the 1950s. The Third Assessment (2001) made a similar statement with approximately 66 percent certainty, while the Fourth Assessment Report (AR4) (2007) found that “most of the observed increase in global average temperatures since the mid-20th century is very likely (greater than 90 percent chance) due to the observed increase in anthropogenic greenhouse gas concentrations.” Human Activity
 made a similar statement with approximately 66 percent certainty, while the Fourth Assessment Report (AR4) (2007) found that most of the observed increase in global average temperatures since the mid-20th century is very likely (greater than 90 percent chance) due to the observed increase in anthropogenic greenhouse gas concentrations. Each IPCC report has been progressively stronger in attributing climate change to human activities.progressively stronger The AR5 contains the strongest statement yet, saying it is extremely likely (a greater than 95 percent chance) that human activities are the dominant cause of the observed warming since the 1950s. The Third Assessment (2001) made a similar statement with approximately 66 percent certainty, while the Fourth Assessment Report (AR4) (2007) found that most of the observed increase in global average temperatures since the mid-20th century is very likely (greater than 90 percent chance) due to the observed increase in anthropogenic greenhouse gas concentrations. Human Activity.")
8
The AR4 concluded that “warming of the climate system is unequivocal.” The AR5 goes further, concluding that many observed changes (warming of the atmosphere and ocean, sea level rise and melting ice) are “unprecedented over decades to millennia.” New atmospheric temperature measurements in the AR5 show an estimated warming of 0.85 degrees Celsius since 1880 with the fastest rate of warming in the Arctic. The AR4 estimated the average warming across the globe over the past century (1906-2005) was 0.74 C. The AR4 concluded that “warming of the climate system is unequivocal.” The AR5 goes further, concluding that many observed changes (warming of the atmosphere and ocean, sea level rise and melting ice) are “unprecedented over decades to millennia.” New atmospheric temperature measurements in the AR5 show an estimated warming of 0.85 degrees Celsius since 1880 with the fastest rate of warming in the Arctic. The AR4 estimated the average warming across the globe over the past century (1906-2005) was 0.74 C. Global Changes
 was 0.74 C. The AR4 concluded that warming of the climate system is unequivocal. The AR5 goes further, concluding that many observed changes (warming of the atmosphere and ocean, sea level rise and melting ice) are unprecedented over decades to millennia. New atmospheric temperature measurements in the AR5 show an estimated warming of 0.85 degrees Celsius since 1880 with the fastest rate of warming in the Arctic. The AR4 estimated the average warming across the globe over the past century ( ) was 0.74 C. Global Changes.")
9
The AR5 report has significantly increased projected sea level rise over the next century, due to new research that improves understanding of ice sheet movement and melting. The new projections show an increase of 0.26-0.55 meters) by 2100 under a low emissions scenario and 0.52-0.98 meters under the high emissions scenario. The AR4 did not include some of the effects of ice sheet movement due to warming, and therefore published much lower estimates in the range of 0.18-0.38 meters under a low emissions scenario and 0.26-0.59 meters) under a high emissions scenario for sea level rise by 2100. The AR5 report has significantly increased projected sea level rise over the next century, due to new research that improves understanding of ice sheet movement and melting. The new projections show an increase of 0.26-0.55 meters) by 2100 under a low emissions scenario and 0.52-0.98 meters under the high emissions scenario. The AR4 did not include some of the effects of ice sheet movement due to warming, and therefore published much lower estimates in the range of 0.18-0.38 meters under a low emissions scenario and 0.26-0.59 meters) under a high emissions scenario for sea level rise by 2100. Sea Level Rise
 by 2100 under a low emissions scenario and meters under the high emissions scenario. The AR4 did not include some of the effects of ice sheet movement due to warming, and therefore published much lower estimates in the range of meters under a low emissions scenario and meters) under a high emissions scenario for sea level rise by The AR5 report has significantly increased projected sea level rise over the next century, due to new research that improves understanding of ice sheet movement and melting. The new projections show an increase of meters) by 2100 under a low emissions scenario and meters under the high emissions scenario. The AR4 did not include some of the effects of ice sheet movement due to warming, and therefore published much lower estimates in the range of meters under a low emissions scenario and meters) under a high emissions scenario for sea level rise by Sea Level Rise.")
10
The AR5 projects it is likely (greater than 66 percent chance) that the Arctic Ocean will be ice-free during part of the summer before 2050 under a high emissions scenario. This represents a large shift from the AR4, which estimated that the Arctic Ocean would not be ice-free during the summer until late in the 21st century. The AR5 finds that Arctic sea ice surface extent has decreased by 3.5-4.1 percent per decade (9.4-13.6 percent during summer), which is higher than the AR4 estimate of 2.1-3.3 percent per decade (5-9.8 percent during summer). The AR5 finds these changes unprecedented in at least the last 1450 years. The AR5 also states that scientists have “high confidence” (80 percent chance) that glaciers have shrunk worldwide, and that the Greenland and Antarctic Ice Sheets have lost mass over the past two decades. The report notes with “very high confidence” (90 percent chance) that ice loss from Greenland has accelerated during the past two decades. Greenland is now losing about 215 gigatonnes (Gt) per year of ice, while the rest of the world’s glaciers lose about 226 Gt per year. The AR5 projects it is likely (greater than 66 percent chance) that the Arctic Ocean will be ice-free during part of the summer before 2050 under a high emissions scenario. This represents a large shift from the AR4, which estimated that the Arctic Ocean would not be ice-free during the summer until late in the 21st century. The AR5 finds that Arctic sea ice surface extent has decreased by 3.5-4.1 percent per decade (9.4-13.6 percent during summer), which is higher than the AR4 estimate of 2.1-3.3 percent per decade (5-9.8 percent during summer). The AR5 finds these changes unprecedented in at least the last 1450 years. The AR5 also states that scientists have “high confidence” (80 percent chance) that glaciers have shrunk worldwide, and that the Greenland and Antarctic Ice Sheets have lost mass over the past two decades. The report notes with “very high confidence” (90 percent chance) that ice loss from Greenland has accelerated during the past two decades. Greenland is now losing about 215 gigatonnes (Gt) per year of ice, while the rest of the world’s glaciers lose about 226 Gt per year. Sea and Land Ice
, which is higher than the AR4 estimate of percent per decade (5-9.8 percent during summer). The AR5 finds these changes unprecedented in at least the last 1450 years. The AR5 also states that scientists have high confidence (80 percent chance) that glaciers have shrunk worldwide, and that the Greenland and Antarctic Ice Sheets have lost mass over the past two decades. The report notes with very high confidence (90 percent chance) that ice loss from Greenland has accelerated during the past two decades. Greenland is now losing about 215 gigatonnes (Gt) per year of ice, while the rest of the world’s glaciers lose about 226 Gt per year. The AR5 projects it is likely (greater than 66 percent chance) that the Arctic Ocean will be ice-free during part of the summer before 2050 under a high emissions scenario. This represents a large shift from the AR4, which estimated that the Arctic Ocean would not be ice-free during the summer until late in the 21st century. The AR5 finds that Arctic sea ice surface extent has decreased by percent per decade ( percent during summer), which is higher than the AR4 estimate of percent per decade (5-9.8 percent during summer). The AR5 finds these changes unprecedented in at least the last 1450 years. The AR5 also states that scientists have high confidence (80 percent chance) that glaciers have shrunk worldwide, and that the Greenland and Antarctic Ice Sheets have lost mass over the past two decades. The report notes with very high confidence (90 percent chance) that ice loss from Greenland has accelerated during the past two decades. Greenland is now losing about 215 gigatonnes (Gt) per year of ice, while the rest of the world’s glaciers lose about 226 Gt per year. Sea and Land Ice.")
11
After a period of rapid warming during the 1990s, global mean surface temperatures have not warmed as rapidly over the past decade. The AR5 notes there are “differences between simulated and observed trends over periods as short as 10-15 years (e.g., 1998-2012)”. It concludes that the recent reduction in surface warming is probably due to a redistribution of heat in the ocean, volcanic eruptions, and the recent minimum in the 11-year solar cycle. Most importantly, the report specifically points out that these trends should not undermine our confidence in the “big picture” of our understanding of climate change: “trends based on short records are very sensitive to the beginning and end dates and do not in general reflect long-term climate trends.” In addition, there is new research proposing explanations for the recent trends that did not make the deadline to be included in the AR5. One paper suggests that some of this “lost” heat is actually in the deep ocean, while another notes that the warming “pause” is explained by the unusual number of La Niña events in the Pacific Ocean. The second paper by Yu Kosaka and Shang-Ping Xie states that the “current hiatus is part of natural climate variability, tied specifically to a La-Niña-like decadal cooling. Although similar decadal hiatus events may occur in the future, the multi-decadal warming trend is very likely to continue.”deep ocean After a period of rapid warming during the 1990s, global mean surface temperatures have not warmed as rapidly over the past decade. The AR5 notes there are “differences between simulated and observed trends over periods as short as 10-15 years (e.g., 1998-2012)”. It concludes that the recent reduction in surface warming is probably due to a redistribution of heat in the ocean, volcanic eruptions, and the recent minimum in the 11-year solar cycle. Most importantly, the report specifically points out that these trends should not undermine our confidence in the “big picture” of our understanding of climate change: “trends based on short records are very sensitive to the beginning and end dates and do not in general reflect long-term climate trends.” In addition, there is new research proposing explanations for the recent trends that did not make the deadline to be included in the AR5. One paper suggests that some of this “lost” heat is actually in the deep ocean, while another notes that the warming “pause” is explained by the unusual number of La Niña events in the Pacific Ocean. The second paper by Yu Kosaka and Shang-Ping Xie states that the “current hiatus is part of natural climate variability, tied specifically to a La-Niña-like decadal cooling. Although similar decadal hiatus events may occur in the future, the multi-decadal warming trend is very likely to continue.”deep ocean Surface Warming “Pause”
 . It concludes that the recent reduction in surface warming is probably due to a redistribution of heat in the ocean, volcanic eruptions, and the recent minimum in the 11-year solar cycle. Most importantly, the report specifically points out that these trends should not undermine our confidence in the big picture of our understanding of climate change: trends based on short records are very sensitive to the beginning and end dates and do not in general reflect long-term climate trends. In addition, there is new research proposing explanations for the recent trends that did not make the deadline to be included in the AR5. One paper suggests that some of this lost heat is actually in the deep ocean, while another notes that the warming pause is explained by the unusual number of La Niña events in the Pacific Ocean. The second paper by Yu Kosaka and Shang-Ping Xie states that the current hiatus is part of natural climate variability, tied specifically to a La-Niña-like decadal cooling. Although similar decadal hiatus events may occur in the future, the multi-decadal warming trend is very likely to continue. deep ocean After a period of rapid warming during the 1990s, global mean surface temperatures have not warmed as rapidly over the past decade. The AR5 notes there are differences between simulated and observed trends over periods as short as years (e.g., ) . It concludes that the recent reduction in surface warming is probably due to a redistribution of heat in the ocean, volcanic eruptions, and the recent minimum in the 11-year solar cycle. Most importantly, the report specifically points out that these trends should not undermine our confidence in the big picture of our understanding of climate change: trends based on short records are very sensitive to the beginning and end dates and do not in general reflect long-term climate trends. In addition, there is new research proposing explanations for the recent trends that did not make the deadline to be included in the AR5. One paper suggests that some of this lost heat is actually in the deep ocean, while another notes that the warming pause is explained by the unusual number of La Niña events in the Pacific Ocean. The second paper by Yu Kosaka and Shang-Ping Xie states that the current hiatus is part of natural climate variability, tied specifically to a La-Niña-like decadal cooling. Although similar decadal hiatus events may occur in the future, the multi-decadal warming trend is very likely to continue. deep ocean Surface Warming Pause .")
12
The AR5 relates different carbon “budgets” – an accumulated amount of carbon emissions over time — to the chances of average warming exceeding 2 degrees above 1861-1880 levels. Governments have set an international goal of limiting average warming to 2 C. For the world to have a 50 percent chance of staying below 2 C of warming by 2100, the AR5 identifies a greenhouse gas emissions budget of 840Gt of carbon. More than half of that (over 531GtC) has already been emitted. At current emission rates (around 10 GtC per year), we will use up our carbon budget in just 30 years. The AR5 relates different carbon “budgets” – an accumulated amount of carbon emissions over time — to the chances of average warming exceeding 2 degrees above 1861-1880 levels. Governments have set an international goal of limiting average warming to 2 C. For the world to have a 50 percent chance of staying below 2 C of warming by 2100, the AR5 identifies a greenhouse gas emissions budget of 840Gt of carbon. More than half of that (over 531GtC) has already been emitted. At current emission rates (around 10 GtC per year), we will use up our carbon budget in just 30 years. Cumulative Carbon Budgets
 has already been emitted. At current emission rates (around 10 GtC per year), we will use up our carbon budget in just 30 years. The AR5 relates different carbon budgets – an accumulated amount of carbon emissions over time — to the chances of average warming exceeding 2 degrees above levels. Governments have set an international goal of limiting average warming to 2 C. For the world to have a 50 percent chance of staying below 2 C of warming by 2100, the AR5 identifies a greenhouse gas emissions budget of 840Gt of carbon. More than half of that (over 531GtC) has already been emitted. At current emission rates (around 10 GtC per year), we will use up our carbon budget in just 30 years. Cumulative Carbon Budgets.")
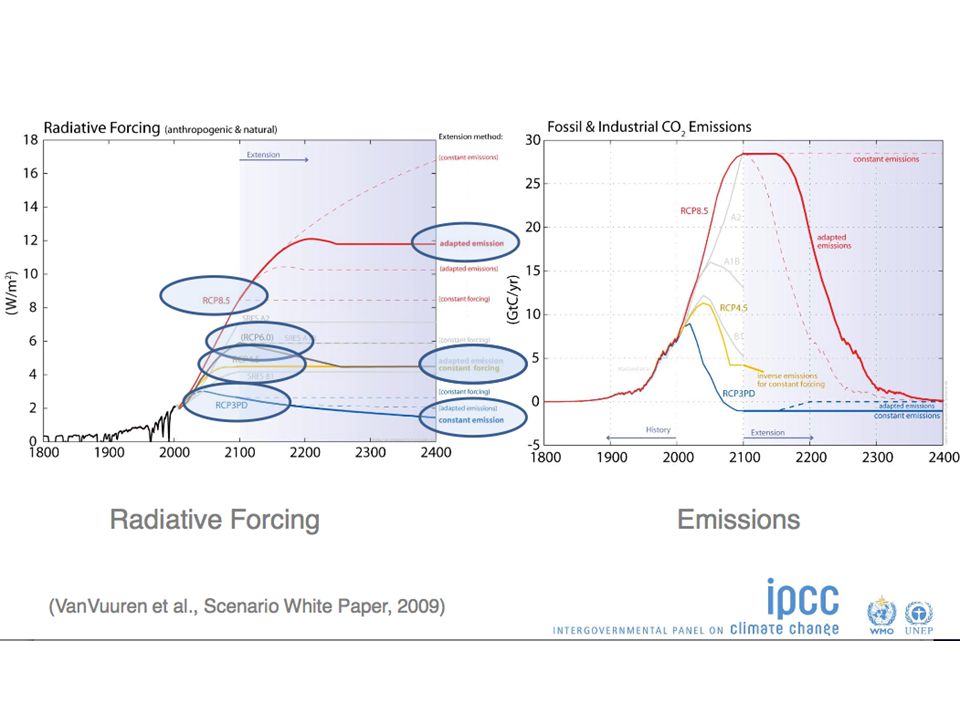
13
The report describes several alternative scenarios of 21st century greenhouse gas concentrations and global temperatures, each associated with different cumulative carbon budgets. Three scenarios represent potential pathways with less warming under various forms of mitigation policy. The fourth represents more of a business-as-usual case, with emissions in the 21st century three to four times larger than the emissions before the 20th century and the highest level of warming in any scenario. The report describes several alternative scenarios of 21st century greenhouse gas concentrations and global temperatures, each associated with different cumulative carbon budgets. Three scenarios represent potential pathways with less warming under various forms of mitigation policy. The fourth represents more of a business-as-usual case, with emissions in the 21st century three to four times larger than the emissions before the 20th century and the highest level of warming in any scenario. Future Emission Scenarios

14
For comparison, here are the IPCC’s projections in four key areas: from the 2013 AR5, in bold – from the 2007 AR4, in regular type: Probable temperature rise by 2100: 1.5-4°C under most scenarios – from 1.8-4°C Sea level rise: very likely faster than between 1971 and 2010 – by 28-43 cm Arctic summer sea ice disappears: very likely it will continue to shrink and thin – in second half of century Increase in heat waves: very likely to occur more frequently and last longer – increase very likely For comparison, here are the IPCC’s projections in four key areas: from the 2013 AR5, in bold – from the 2007 AR4, in regular type: Probable temperature rise by 2100: 1.5-4°C under most scenarios – from 1.8-4°C Sea level rise: very likely faster than between 1971 and 2010 – by 28-43 cm Arctic summer sea ice disappears: very likely it will continue to shrink and thin – in second half of century Increase in heat waves: very likely to occur more frequently and last longer – increase very likely Summary - main conclusions

15
Some highlights specifically relevant in our case

16
Irreversibility and Abrupt Change Abrupt Climate Change Linked with AMOC Irreversibility and Abrupt Change Abrupt Climate Change Linked with AMOC

18
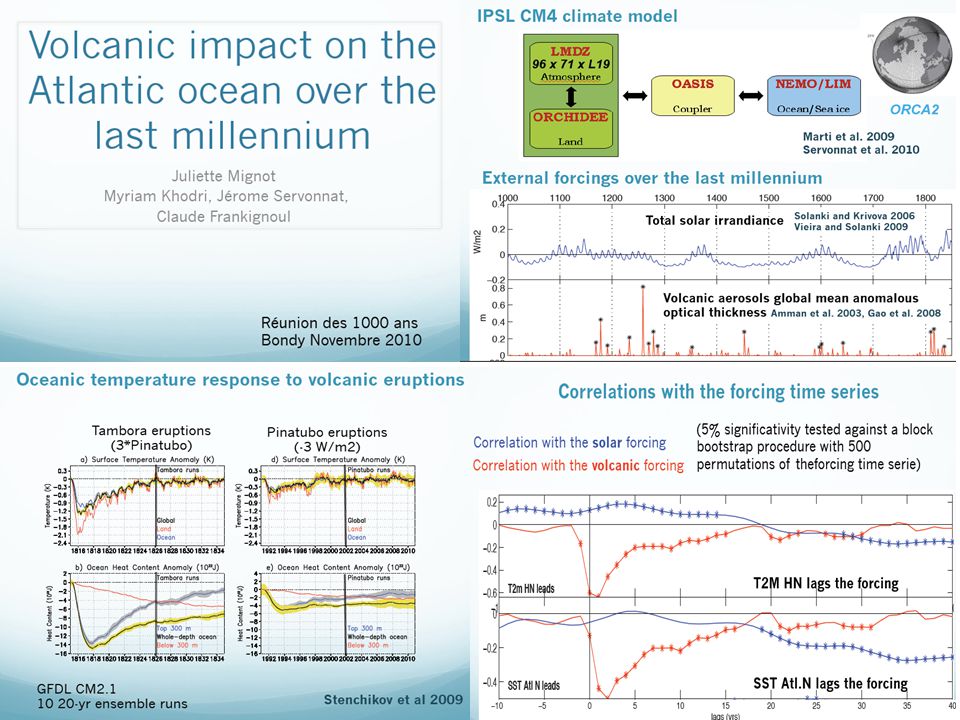
Last 1000 yrs:

19
Cruz et al. 2009 Análise de espeleotemas - cavernas -

20
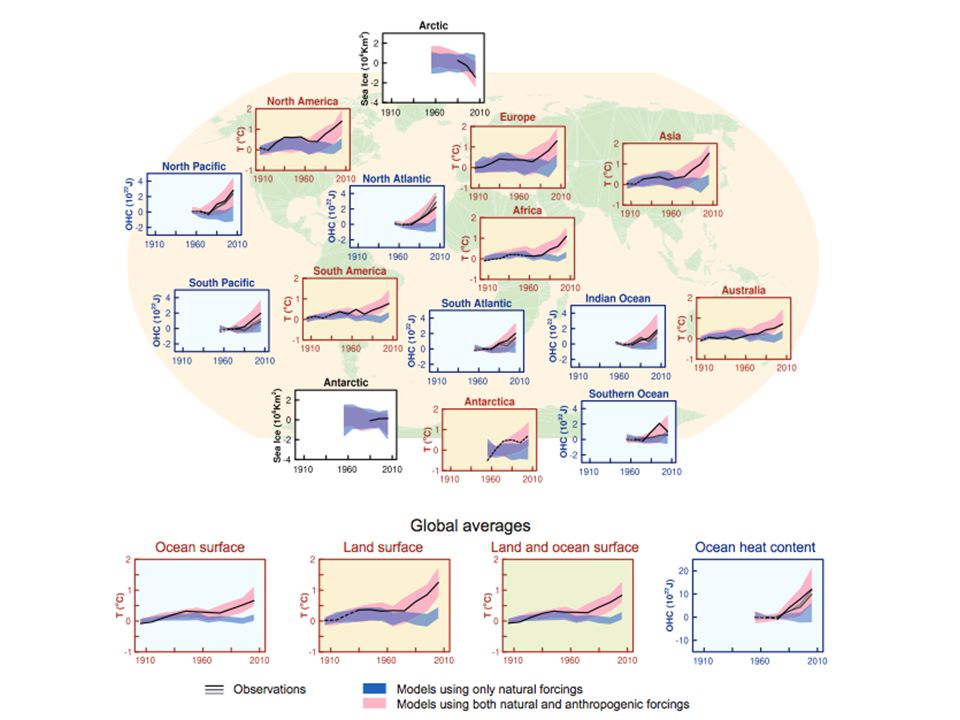
Global means and average of all CMIP5 models show indicate a broad picture

21
Percent change in precipitation from the years 1980-1999 to 2080-2099 under the A1B scenario. Brown indicates a reduction in precipitation and green an increase. The per cent change in the precipitation averaged over all models is shown in the lower right hand corner. However, regionally, there are significant differences…

22
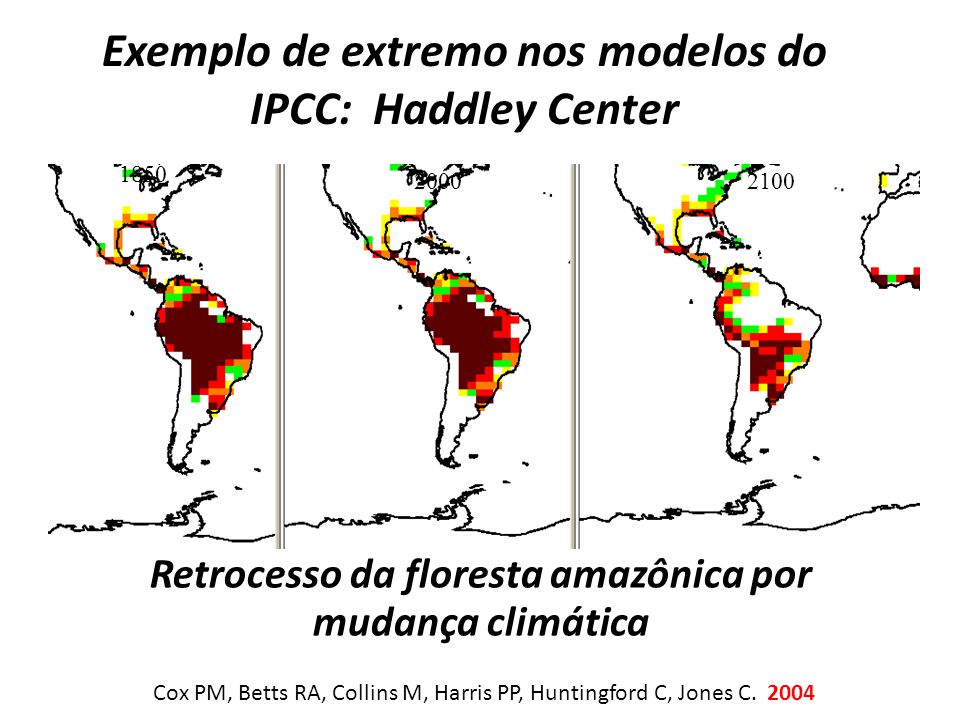
Um exemplo de incerteza nos modelos que nos afeta diretamente: Aquecimento global e floresta amazônica: Exemplo de potencial efeito “catastrófico” frequentemente usado: Haddley Center Um exemplo de incerteza nos modelos que nos afeta diretamente: Aquecimento global e floresta amazônica: Exemplo de potencial efeito “catastrófico” frequentemente usado: Haddley Center

23
Retrocesso da floresta amazônica por mudança climática 1850 20002100 Exemplo de extremo nos modelos do IPCC: Haddley Center Cox PM, Betts RA, Collins M, Harris PP, Huntingford C, Jones C. 2004
24
Entretanto, há considerável discrepância entre modelos semelhantes…(C 4 MIP-IPCC -2007)
")
26
Climate change will very likely affect most forests in Amazonia during the course of the 21st century, but the direction and intensity of the change are uncertain, in part because of differences in rainfall projections. In order to constrain this uncertainty, we estimate the probability for biomass change in Amazonia on the basis of rainfall projections that are weighted by climate model performance for current conditions. We estimate the risk of forest dieback by using weighted rainfall projections from 24 general circulation models (GCMs) to create probability density functions (PDFs) for future forest biomass changes simulated by a dynamic vegetation model (LPJmL).. The uncertainty associated with the long-term effect of CO2 is much larger than that associated with precipitation change. This underlines the importance of reducing uncertainties in the direct effects of CO2 on tropical ecosystems. Climate change will very likely affect most forests in Amazonia during the course of the 21st century, but the direction and intensity of the change are uncertain, in part because of differences in rainfall projections. In order to constrain this uncertainty, we estimate the probability for biomass change in Amazonia on the basis of rainfall projections that are weighted by climate model performance for current conditions. We estimate the risk of forest dieback by using weighted rainfall projections from 24 general circulation models (GCMs) to create probability density functions (PDFs) for future forest biomass changes simulated by a dynamic vegetation model (LPJmL).. The uncertainty associated with the long-term effect of CO2 is much larger than that associated with precipitation change. This underlines the importance of reducing uncertainties in the direct effects of CO2 on tropical ecosystems. Our probabilistic assessment of biomass change suggests a likely shift towards increasing biomass compared with nonweighted results. Biomass estimates range between a gain of 6.2 and a loss of 2.7 kg carbon m)2 for the Amazon region, depending on the strength of CO2 fertilization 2010
 to create probability density functions (PDFs) for future forest biomass changes simulated by a dynamic vegetation model (LPJmL).. The uncertainty associated with the long-term effect of CO2 is much larger than that associated with precipitation change. This underlines the importance of reducing uncertainties in the direct effects of CO2 on tropical ecosystems. Climate change will very likely affect most forests in Amazonia during the course of the 21st century, but the direction and intensity of the change are uncertain, in part because of differences in rainfall projections. In order to constrain this uncertainty, we estimate the probability for biomass change in Amazonia on the basis of rainfall projections that are weighted by climate model performance for current conditions. We estimate the risk of forest dieback by using weighted rainfall projections from 24 general circulation models (GCMs) to create probability density functions (PDFs) for future forest biomass changes simulated by a dynamic vegetation model (LPJmL).. The uncertainty associated with the long-term effect of CO2 is much larger than that associated with precipitation change. This underlines the importance of reducing uncertainties in the direct effects of CO2 on tropical ecosystems. Our probabilistic assessment of biomass change suggests a likely shift towards increasing biomass compared with nonweighted results. Biomass estimates range between a gain of 6.2 and a loss of 2.7 kg carbon m)2 for the Amazon region, depending on the strength of CO2 fertilization")
27
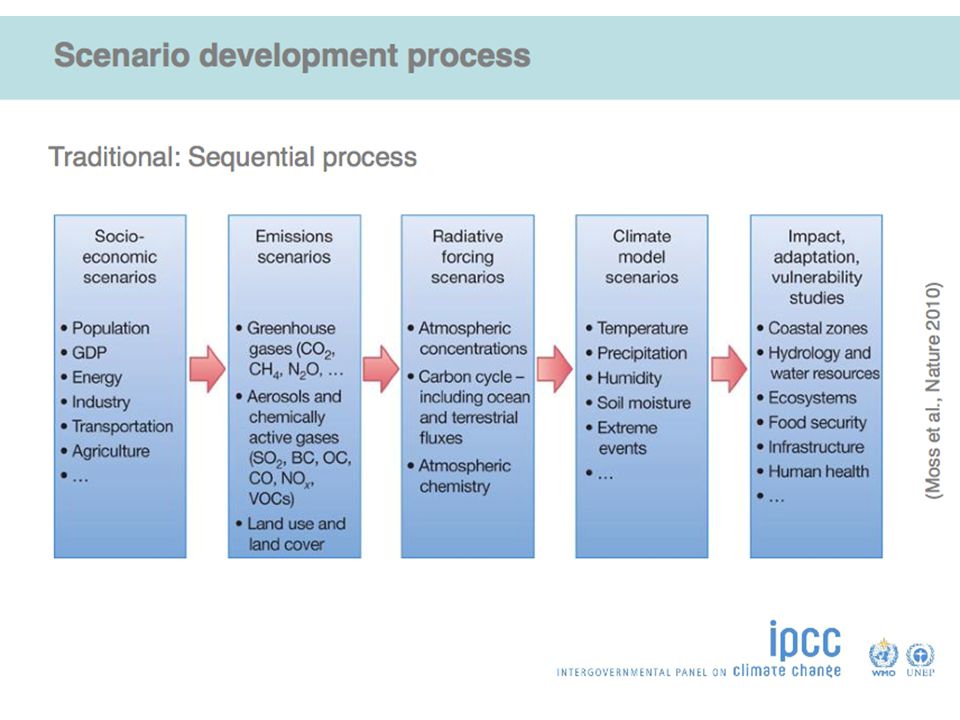
Moss et al (2010) The next generation on scenarios for climate change research and assessment. Nature 463:747-756

28
Mensagem: não devemos analisar somente os modelos que indicam extremos…. É preciso ponderar os modelos em função da capacidade de reproduzir o clima do sec. XX!! Mensagem: não devemos analisar somente os modelos que indicam extremos…. É preciso ponderar os modelos em função da capacidade de reproduzir o clima do sec. XX!!

29
Aumento do conhecimento e entendimento sobre o sistema climático leva a diminuição da incerteza? Aumento do conhecimento e entendimento sobre o sistema climático leva a diminuição da incerteza? Consenso: a incerteza nos cenários climáticos no próximo levantamento do IPCC (AR5) deverá ser maior que nos levantamentos anteriores!!!! Consenso: a incerteza nos cenários climáticos no próximo levantamento do IPCC (AR5) deverá ser maior que nos levantamentos anteriores!!!! Enquanto nosso conhecimento sobre certos fatores aumenta, aumenta também nosso entendimento sobre o efeito de fatores que não considerávamos ou que sequer reconheciamos !!!
 deverá ser maior que nos levantamentos anteriores!!!. Consenso: a incerteza nos cenários climáticos no próximo levantamento do IPCC (AR5) deverá ser maior que nos levantamentos anteriores!!!. Enquanto nosso conhecimento sobre certos fatores aumenta, aumenta também nosso entendimento sobre o efeito de fatores que não considerávamos ou que sequer reconheciamos !!!.")
30
Mudanças Climáticas: certezas, incertezas e desafios. Papel do Cientista na Formulação de Políticas Públicas 1. Cientista Puro – afastado dos formuladores de políticas públicas - 3. Cientista Defensor de Causas – focado numa agenda política (econômica, religiosa etc...) em particular. 2. Cientista Árbitro – focado em questões que podem ser resolvidas pela ciência 4. O “Corretor Honesto” de alternativas políticas - este lida diretamente com as incertezas científicas e interage com o formulador de políticas públicas Baseado em (R. Pielke Jr - The Honest Broker - 2007 )
 em particular. 2. Cientista Árbitro – focado em questões que podem ser resolvidas pela ciência 4. O Corretor Honesto de alternativas políticas - este lida diretamente com as incertezas científicas e interage com o formulador de políticas públicas Baseado em (R. Pielke Jr - The Honest Broker ).")
31
Obrigado pldsdias@lncc.br Obrigado pldsdias@lncc.br

Apresentações semelhantes


: (based on and the message from INPAs General Director, Dr Adalberto Val, and on former.>")


 SEGUNDO NOVOS ESTRATOS VITÓRIA, ES – OUTUBRO 2008 Kenneth Camargo – IMS/UERJ Cláudia Medina – IESC/UFRJ.>")


. Uniform Resource Identifiers Uniform Resource Identifiers (URI) ou Identificador de Recursos Uniforme provê um meio.>")

