Carregar apresentação
A apresentação está carregando. Por favor, espere

1
Introdução à Astronomia
O Sol Jorge Hönel (Físico)
")
2
Importância do Sol Estrela mais próxima “Responsável pela vida”
Caráter Divino Para Astronomia: Não é só um ponto! Estrela típica Base para entendermos as outras estrelas

3
https://encrypted-tbn2. gstatic. com/images
Ocaso do Sol

4
Aurora de Outubro nos Céus da Pradaria Créditos e direitos autorais : Randy Halverson Explicação: O vento e a meteorologia espacial estão transformados nesta inesquecível paisagem celeste noturna. O registro do moinho de vento na pradaria e da colorida exibição da aurora foi feito em 1o de outubro na Dakota do Sul central, EUA, ao início de uma boa temporada para os caçadores de auroras, quando as noites ficam mais longas. Do verde até os mais raros tons de vermelho, as luzes do norte são desencadeadas por tempestades geomagnéticas causadas pela atividade solar. Elas se estendem muito acima da massa de nuvens, até altitudes bem acima dos 100 quilômetros, contra o fundo de estrelas distantes na noite do hemisfério norte. A estrela dupla optica Mizar, que marca o meio do cabo da Grande Concha, é fácil de ver à esquerda da chapa. Merak e Dubhe, estrelas da Grande Concha que apontam o Polo Norte Celeste, enfileiram-se verticalmente próximas ao centro da foto. Auroras

5
Arco-Íris

6
Detalhe de um Arco-Íris
Detalhe de um Arco-Íris

7
The following article has been provided by Barlow Bob, founder & organizer of the NEAF Solar Star Party and regional event host & lecturer on all things involving solar spectroscopy. You can read more about Barlow Bob and see some of his other articles atwww.neafsolar.com/barlowbob.html. Prisma de Newton

8
The following article has been provided by Barlow Bob, founder & organizer of the NEAF Solar Star Party and regional event host & lecturer on all things involving solar spectroscopy. You can read more about Barlow Bob and see some of his other articles atwww.neafsolar.com/barlowbob.html. Espectro solar

9
http://sohowww. nascom. nasa
SOHO

11
HMI (Helioseismic and Magnetic Imager)The Helioseismic and Magnetic Imager extends the capabilities of the SOHO/MDI instrument with continual full-disk coverage at higher spatial resolution and new vector magnetogram capabilities. PI: Phil Scherrer, PI Institution: Stanford University.View Stanford instrument site AIA (Atmospheric Imaging Assembly)The Atmospheric Imaging Assembly images the solar atmosphere in multiple wavelengths to link changes in the surface to interior changes. Data includes images of the Sun in 10 wavelengths every 10 seconds. PI: Alan Title, PI Institution: Lockheed Martin Solar Astrophysics Laboratory.View Lockheed Martin instrument site EVE (Extreme Ultraviolet Variablity Experiment)The Extreme Ultraviolet Variablity Experiment measures the solar extreme-ultraviolet (EUV) irradiance with unprecedented spectral resolution, temporal cadence, and precision. EVE measures the solar extreme ultraviolet (EUV) spectral irradiance to understand variations on the timescales which influence Earth's climate and near-Earth space. PI: Tom Woods, PI Institution: University of Colorado.View Colorado instrument site
The Helioseismic and Magnetic Imager extends the capabilities of the SOHO/MDI instrument with continual full-disk coverage at higher spatial resolution and new vector magnetogram capabilities. PI: Phil Scherrer, PI Institution: Stanford University.View Stanford instrument site. AIA (Atmospheric Imaging Assembly)The Atmospheric Imaging Assembly images the solar atmosphere in multiple wavelengths to link changes in the surface to interior changes. Data includes images of the Sun in 10 wavelengths every 10 seconds. PI: Alan Title, PI Institution: Lockheed Martin Solar Astrophysics Laboratory.View Lockheed Martin instrument site. EVE (Extreme Ultraviolet Variablity Experiment)The Extreme Ultraviolet Variablity Experiment measures the solar extreme-ultraviolet (EUV) irradiance with unprecedented spectral resolution, temporal cadence, and precision. EVE measures the solar extreme ultraviolet (EUV) spectral irradiance to understand variations on the timescales which influence Earth s climate and near-Earth space. PI: Tom Woods, PI Institution: University of Colorado.View Colorado instrument site.")
12
Images from the Solar Dynamics Observatory (SDO) Atmospheric Imaging Assembly (AIA) Fe XVIII 94 Å 2012/01/27 19:06:02 Fe XX 131 Å 2012/01/27 19:06:11 Fe IX/X 171 Å 2012/01/27 19:06:00 Fe XII 193 Å 2012/01/27 19:06:10 Fe XIV 211 Å 2012/01/27 19:06:00 He II 304 Å 2012/01/27 19:06:08 Fe XVI 335 Å 2012/01/27 19:06:03 cont. + C IV 1600 Å 2012/01/27 19:06:17 continuum 1700 Å 2012/01/27 19:06:07 continuum 4500 Å 2012/01/27 19:00:08 A Note on Color Tables The color tables used to display AIA images here are the ones used to display similar bandpasses for SOHO EIT and STEREO EUVI images. The color tables preferred by the AIA Principal Investigator Team can be found in the images at the LMSAL Sun Today site. Color tables for the 94, 131, and 335 Å bandpasses are still under development.

13
The Atmospheric Imaging Assembly (AIA) on board the Solar Dynamics Observatory is essentially a series of cameras set up to take images of the Sun every few seconds and through a variety of filters. This video is a 11 hour series of data gathered by the 304Å filter. This filter is designed to show areas of cooler dense filaments and prominences of plasma above the visible surface of the Sun. The video shows activity in AR11401 and AR11402 on from 03:00 to 14:00. There are almost 1100 images used to make the frames for the video, so you're seeing real time sped up by almost 1000 times.
 on board the Solar Dynamics Observatory is essentially a series of cameras set up to take images of the Sun every few seconds and through a variety of filters. This video is a 11 hour series of data gathered by the 304Å filter. This filter is designed to show areas of cooler dense filaments and prominences of plasma above the visible surface of the Sun. The video shows activity in AR11401 and AR11402 on from 03:00 to 14:00. There are almost 1100 images used to make the frames for the video, so you re seeing real time sped up by almost 1000 times.")
14
Características Raio = 700 mil km ( = 109 RaiosTerra)
Massa = 2x1030 kg ( = 333 mil MassaTerra) Temperatura superficial = 6000oC Temperatura Central = 15 milhõesoC Luminosidade = 3.9x1026 Watts These pictures show the Sun in ultraviolet "light". The left picture was at "solar min". The right picture was at "solar max". This UV wavelength (30.4 nanometers) helps scientists see certain parts of the Sun's atmosphere. The UV "light" is given off by helium at temperatures around 60,000 to 80,000 kelvins. Images courtesy of SOHO (NASA & ESA). Composição Química: 92.1% H 7.8% He
 Temperatura superficial = 6000oC. Temperatura Central = 15 milhõesoC. Luminosidade = 3.9x1026 Watts. These pictures show the Sun in ultraviolet light . The left picture was at solar min . The right picture was at solar max . This UV wavelength (30.4 nanometers) helps scientists see certain parts of the Sun s atmosphere. The UV light is given off by helium at temperatures around 60,000 to 80,000 kelvins. Images courtesy of SOHO (NASA & ESA). id= Object=Sun&Display=Facts&System=Metric. Composição Química: 92.1% H. 7.8% He.")
15
Estrutura do Sol (fração do Raio Solar) Núcleo: 25% Zona Radiativa:
25% – 70% Zona Convectiva: 70% – 100% Atmosfera: Fotosfera Cromosfera Coroa Estrutura do Sol Sol, a nossa Estrela O modelo representado na figura mostra as principais regiões do Sol. A fotosfera, com cerca de 330 km de espessura e temperatura de 5785 K, é a camada visível do Sol. Logo abaixo da fotosfera se localiza a zona convectiva, se estendendo por cerca de 15% do raio solar. Abaixo dessa camada está a zona radiativa, onde a energia flui por radiação. O núcleo, com temperatura de cerca de 10 milhões de graus Kelvin, é a região onde a energia é produzida, por reações termo-nucleares. A cromosfera é a camada da atmosfera solar logo acima da fotosfera. Ela tem cor avermelhada e é visível durante os eclipses solares, logo antes e após a totalidade. Estende-se por 10 mil km acima da fotosfera e a temperatura cresce da base para o topo, tendo um valor médio de 15 mil K. Ainda acima da cromosfera se encontra a coroa, também visível durante os eclipses totais. A coroa se estende por cerca de dois raios solares. A fotosfera Foto do Sol na linha de 584 Å do hélio (HeI), obtida pelo satélite SOHO (The Solar and Heliospheric Observatory), da ESA/NASA A fotosfera do Sol tem a aparência da superfície de um líquido em ebulição, cheia de bolhas, ou grânulos. Este fenômeno é chamado de granulação fotosférica. Os grânulos têm em torno de 5000 km de diâmetro e duram cerca de 10 min cada. Eles marcam os topos das colunas convectivas de gás quente, que se forma na zona convectiva, logo abaixo da fotosfera. As regiões escuras entre os grânulos são regiões onde o gás mais frio e mais denso escorrem para baixo. Foto do Sol em luz branca, mostrando algumas manchas solares O fenômeno fotosférico mais notável é o das manchas solares,regiões irregulares que aparecem mais escuras do que a fotosfera circundante e que muitas vezes podem ser observadas mesmo a olho nu, embora olhar diretamente para o Sol só não é perigoso quando ele está no horizonte. As manchas foram registradas na China já no ano 28 a.C., mas seu estudo científico começou com o uso do telescópio, sendo observadas (por projeção da imagem do Sol) por Galileo, Thomas Harriot ( ) já em 1610 e por Johannes ( ) e David Fabricius ( ) e por Christoph Scheiner ( ) em São constituídas de duas partes: a umbra, parte central mais escura, com temperaturas em torno de 3800 K, e a penumbra, região um pouco mais clara e com estrutura radial em torno da umbra. As manchas solares tendem a se formar em grupos e estão associadas a intensos campos magnéticos no Sol. As manchas solares seguem um ciclo de 11 anos em que o número de manchas varia entre máximos e mínimos, descoberto em 1843 pelo astrônomo amador alemão Samuel Heinrich Schwabe ( ). No gráfico abaixo, está registrado o número médio mensal de manchas. Distribuição de temperatura e densidade na atmosfera do Sol. A cromosfera A cromosfera do Sol normalmente não é visível, porque sua radiação é muito mais fraca do que a da fotosfera. Ela pode ser observada, no entanto, durante os eclipses, quando a Lua esconde o disco da fotosfera. Foto do eclipse total de 4 de novembro de 1994, obtida pelos autores em Santa Catarina, Brasil, mostrando a cromosfera. No capítulo de espectroscopia, detalha-se que o Sol tem um espectro contínuo com linhas escuras (de absorção). Esse espectro é o da fotosfera. No entanto, olhando a borda do Sol com um espectroscópio, durante um eclipse, temos a oportunidade de ver por alguns instantes o espectro da cromosfera, feito de linhas brilhantes, que mostram que a cromosfera é constituída de gases quentes que emitem luz na forma de linhas de emissão. Essas linhas são difíceis de serem observadas contra a luz brilhante da fotosfera, por isso não as vemos no espectro solar normal. Uma das linhas cromosféricas de emissão mais brilhantes é a linha de Balmer , no comprimento de onda 6563 Å, que no espectro solar normal aparece em absorção. A linha está no vermelho, por isso a cromosfera tem cor avermelhada. Uma fotografia do Sol tirada com filtro deixa passar apenas a luz da cromosfera e permite ver que a cromosfera tem uma aparência ondulada devido à presença de estruturas chamadas espículas, jatos de gás que se elevam a até 10 mil km acima da borda da cromosfera e duram poucos minutos. As espículas, observadas contra o disco do Sol, aparecem como filamentos escuros; nas bordas, aparecem como labaredas brilhantes. A temperatura na cromosfera varia de 4300 K na base a mais de 40 000 K a 2500 km de altura. Esse aquecimento da cromosfera deve ter uma fonte de energia que não são os fótons produzidos no interior do Sol, pois se a energia fosse gerada por fótons a cromosfera deveria ser mais fria do que fotosfera, e não mais quente. Atualmente se pensa que a fonte de energia são campos magnéticos variáveis formados na fotosfera e transportados para a coroa por correntes elétrica, deixando parte de sua energia na cromosfera. A Coroa Foto do Sol obtida pela estação espacial Skylab da NASA em 19 de dezembro de 1973, com um dos mais espectacular flares solares já gravados. A proeminência abrange mais de 588 000 km. Os pólos solares apresentam pouca super-granulação e um tom mais escuro do que o centro do disco. A cromosfera gradualmente se funde na coroa, a camada mais externa e mais rarefeita da atmosfera do Sol. A coroa também é melhor observada durante eclipses, pois apesar de ter um brilho equivalente ao da lua cheia, ela fica obscurecida quando a fotosfera é visível. O espectro da coroa mostra linhas muito brilhantes que, até 1940, não eram conhecidas. Atualmente sabemos que elas são produzidas por átomos de ferro, níquel, neônio e cálcio altamente ionizados e não por algum elemento estranho, como anteriormente foi pensado. O fato de existirem esses elementos várias vezes ionizados na coroa implica que sua temperatura deve ser muito alta, pois é necessária muita energia para arrancar muitos elétrons de um átomo. A coroa deve ter uma temperatura em torno de 1 milhão de graus Kelvin.Imagem obtida pelo satélite Transition Region and Coronal Explorer, da NASA, mostrando que o gás nos arcos se move balisticamente e é aquecido a partir da base dos mesmos. A elevação da temperatura na coroa deve ter origem no mesmo processo físico que aquece a cromosfera: transporte de energia por correntes elétricas induzidas por campos magnéticos variáveis. Da coroa emana o vento solar, um fluxo contínuo de partículas emitidas da coroa que acarretam uma perda de massa por parte do sol em torno de por ano. O vento solar que atinge a Terra (aproximadamente 7 prótons/cm3 viajando a cerca de 400 km/s) é capturado pelo campo magnético da Terra, formando o cinturão de Van Allen, na magnetosfera terrestre. Este cinturão, descoberto pelo físico americano James Alfred Van Allen (1914-) em 1958, só permite que as partículas carregadas entrem na atmosfera da Terra pelos pólos, causando as auroras, fenômenos luminosos de excitação e des-excitação dos átomos de oxigênio.
, obtida pelo satélite SOHO (The Solar and Heliospheric Observatory), da ESA/NASA. A fotosfera do Sol tem a aparência da superfície de um líquido em ebulição, cheia de bolhas, ou grânulos. Este fenômeno é chamado de granulação fotosférica. Os grânulos têm em torno de 5000 km de diâmetro e duram cerca de 10 min cada. Eles marcam os topos das colunas convectivas de gás quente, que se forma na zona convectiva, logo abaixo da fotosfera. As regiões escuras entre os grânulos são regiões onde o gás mais frio e mais denso escorrem para baixo. Foto do Sol em luz branca, mostrando algumas manchas solares. O fenômeno fotosférico mais notável é o das manchas solares,regiões irregulares que aparecem mais escuras do que a fotosfera circundante e que muitas vezes podem ser observadas mesmo a olho nu, embora olhar diretamente para o Sol só não é perigoso quando ele está no horizonte. As manchas foram registradas na China já no ano 28 a.C., mas seu estudo científico começou com o uso do telescópio, sendo observadas (por projeção da imagem do Sol) por Galileo, Thomas Harriot ( ) já em 1610 e por Johannes ( ) e David Fabricius ( ) e por Christoph Scheiner ( ) em São constituídas de duas partes: a umbra, parte central mais escura, com temperaturas em torno de 3800 K, e a penumbra, região um pouco mais clara e com estrutura radial em torno da umbra. As manchas solares tendem a se formar em grupos e estão associadas a intensos campos magnéticos no Sol. As manchas solares seguem um ciclo de 11 anos em que o número de manchas varia entre máximos e mínimos, descoberto em 1843 pelo astrônomo amador alemão Samuel Heinrich Schwabe ( ). No gráfico abaixo, está registrado o número médio mensal de manchas. Distribuição de temperatura e densidade na atmosfera do Sol. A cromosfera. A cromosfera do Sol normalmente não é visível, porque sua radiação é muito mais fraca do que a da fotosfera. Ela pode ser observada, no entanto, durante os eclipses, quando a Lua esconde o disco da fotosfera. Foto do eclipse total de 4 de novembro de 1994, obtida pelos autores em Santa Catarina, Brasil, mostrando a cromosfera. No capítulo de espectroscopia, detalha-se que o Sol tem um espectro contínuo com linhas escuras (de absorção). Esse espectro é o da fotosfera. No entanto, olhando a borda do Sol com um espectroscópio, durante um eclipse, temos a oportunidade de ver por alguns instantes o espectro da cromosfera, feito de linhas brilhantes, que mostram que a cromosfera é constituída de gases quentes que emitem luz na forma de linhas de emissão. Essas linhas são difíceis de serem observadas contra a luz brilhante da fotosfera, por isso não as vemos no espectro solar normal. Uma das linhas cromosféricas de emissão mais brilhantes é a linha de Balmer , no comprimento de onda 6563 Å, que no espectro solar normal aparece em absorção. A linha está no vermelho, por isso a cromosfera tem cor avermelhada. Uma fotografia do Sol tirada com filtro deixa passar apenas a luz da cromosfera e permite ver que a cromosfera tem uma aparência ondulada devido à presença de estruturas chamadas espículas, jatos de gás que se elevam a até 10 mil km acima da borda da cromosfera e duram poucos minutos. As espículas, observadas contra o disco do Sol, aparecem como filamentos escuros; nas bordas, aparecem como labaredas brilhantes. A temperatura na cromosfera varia de 4300 K na base a mais de K a 2500 km de altura. Esse aquecimento da cromosfera deve ter uma fonte de energia que não são os fótons produzidos no interior do Sol, pois se a energia fosse gerada por fótons a cromosfera deveria ser mais fria do que fotosfera, e não mais quente. Atualmente se pensa que a fonte de energia são campos magnéticos variáveis formados na fotosfera e transportados para a coroa por correntes elétrica, deixando parte de sua energia na cromosfera. A Coroa. Foto do Sol obtida pela estação espacial Skylab da NASA em 19 de dezembro de 1973, com um dos mais espectacular flares solares já gravados. A proeminência abrange mais de km. Os pólos solares apresentam pouca super-granulação e um tom mais escuro do que o centro do disco. A cromosfera gradualmente se funde na coroa, a camada mais externa e mais rarefeita da atmosfera do Sol. A coroa também é melhor observada durante eclipses, pois apesar de ter um brilho equivalente ao da lua cheia, ela fica obscurecida quando a fotosfera é visível. O espectro da coroa mostra linhas muito brilhantes que, até 1940, não eram conhecidas. Atualmente sabemos que elas são produzidas por átomos de ferro, níquel, neônio e cálcio altamente ionizados e não por algum elemento estranho, como anteriormente foi pensado. O fato de existirem esses elementos várias vezes ionizados na coroa implica que sua temperatura deve ser muito alta, pois é necessária muita energia para arrancar muitos elétrons de um átomo. A coroa deve ter uma temperatura em torno de 1 milhão de graus Kelvin.Imagem obtida pelo satélite Transition Region and Coronal Explorer, da NASA, mostrando que o gás nos arcos se move balisticamente e é aquecido a partir da base dos mesmos. A elevação da temperatura na coroa deve ter origem no mesmo processo físico que aquece a cromosfera: transporte de energia por correntes elétricas induzidas por campos magnéticos variáveis. Da coroa emana o vento solar, um fluxo contínuo de partículas emitidas da coroa que acarretam. uma perda de massa por parte do sol em torno de por ano. O vento solar que atinge a Terra (aproximadamente 7 prótons/cm3 viajando a cerca de 400 km/s) é capturado pelo campo magnético da Terra, formando o cinturão de Van Allen, na magnetosfera terrestre. Este cinturão, descoberto pelo físico americano James Alfred Van Allen (1914-) em 1958, só permite que as partículas carregadas entrem na atmosfera da Terra pelos pólos, causando as auroras, fenômenos luminosos de excitação e des-excitação dos átomos de oxigênio.")
16
Reações Termonucleares
Núcleo T = 15 milhões oC Alta densidade Reações Termonucleares Núcleos de H “batem e grudam”, formando núcleos de He e liberando energia

17
Zona de Radiação Transporte de energia por radiação T = 7 2 milhões oC
Luz é espalhada nesta região Caminho aleatório Zona Radiativa Núcleo Energia passa cerca de 1 milhão de anos para conseguir atravessar a Zona Radiativa!!!

18
Zona de Convecção Transporte de energia pelo movimento de matéria
T = 2 milhões oC Gás quente sobe e gás frio desce

19
Fotosfera Responsável pela maior parte da luz visível T = 6000oC
Espessura = 330 km These two pictures show sunspots on the Sun in 2001 (left) and 2003 (right). Sunspots only form near the Sun's equator and are never seen near the Sun's poles. Images courtesy of SOHO/NASA/ESA.
 and 2003 (right). Sunspots only form near the Sun s equator and are never seen near the Sun s poles. Images courtesy of SOHO/NASA/ESA.")
20
Manchas Solares 2000oC mais frias que superfície
Vida média: dias a semanas Campo magnético milhares de vezes maior que o terrestre polaridade umbra e penumbra Acompanha Rotação Diferencial do Sol These are two pictures of different sunspots. The picture on the left shows the whole Sun with some large sunspot groups on it. The sunspot groups in that picture are as big as the giant planet Jupiter. The picture on the right is a closeup of some other sunspots. The larger sunspot on the right (top) is bigger than Earth! Images courtesy SOHO (NASA & ESA) and the Royal Swedish Academy of Sciences.
 is bigger than Earth! Images courtesy SOHO (NASA & ESA) and the Royal Swedish Academy of Sciences. id=193.")
21
SDO took a closer look as a barely emerging sunspot group really grew and mushroomed into a large sunspot group over less than three days (Jan. 6-8, 2012). Sunspots are almost always changing, but the speed of growth here was quite striking. Sunspots are cooler, darker regions generated by magnetic forces beneath the Sun's surface. They are often the source for solar storms, although this particular group did not produce any major storms. For a size comparison, the spot on the left of the group is easily larger than Earth.

22
17-18/Julho/2011 Sunspots, which are cooler, darker areas of intense magnetic activity, are most often the source of solar storms. If we take the observations of the Sun's lower atmosphere in extreme ultraviolet light (July 17-18, 2011), then digitally peer down through the atmosphere to video of the surface seen in filtered light, we can see the correlation of the sunspots to the brighter active regions above the surface. The loops above the sunspot regions reveal magnetic field lines pushing out from the Sun. It is a little like sorcery, isn't it?
, then digitally peer down through the atmosphere to video of the surface seen in filtered light, we can see the correlation of the sunspots to the brighter active regions above the surface. The loops above the sunspot regions reveal magnetic field lines pushing out from the Sun. It is a little like sorcery, isn t it v=item&id=60.")
23
17-18/Julho/2011 Sunspots, which are cooler, darker areas of intense magnetic activity, are most often the source of solar storms. If we take the observations of the Sun's lower atmosphere in extreme ultraviolet light (July 17-18, 2011), then digitally peer down through the atmosphere to video of the surface seen in filtered light, we can see the correlation of the sunspots to the brighter active regions above the surface. The loops above the sunspot regions reveal magnetic field lines pushing out from the Sun. It is a little like sorcery, isn't it?
, then digitally peer down through the atmosphere to video of the surface seen in filtered light, we can see the correlation of the sunspots to the brighter active regions above the surface. The loops above the sunspot regions reveal magnetic field lines pushing out from the Sun. It is a little like sorcery, isn t it v=item&id=60.")
24
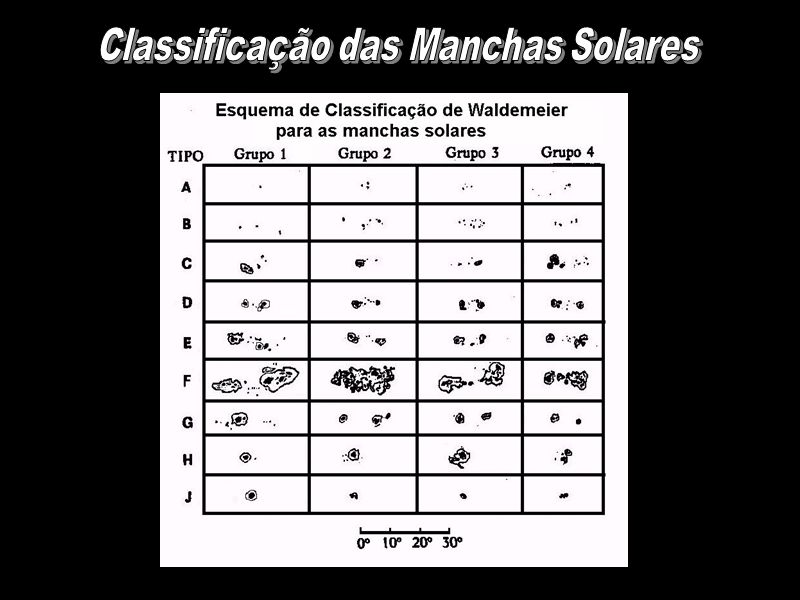
Classificação das Manchas Solares
25
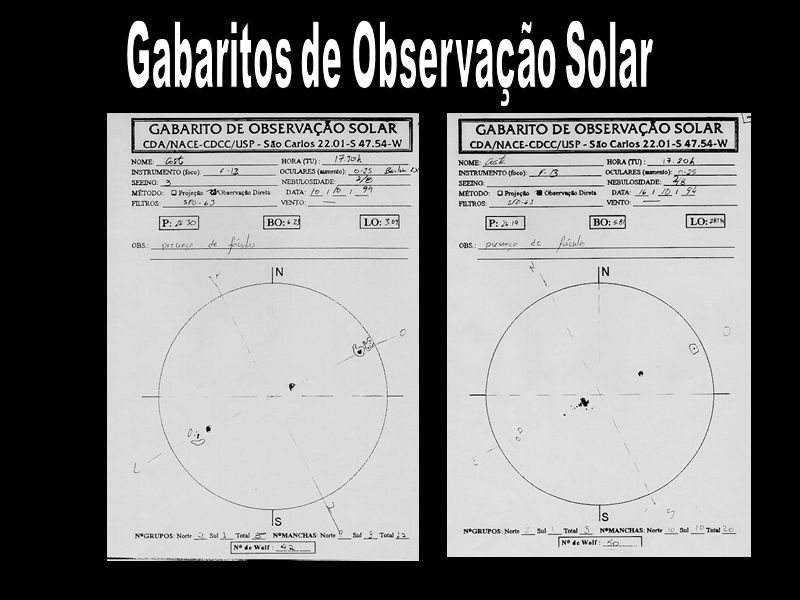
Gabaritos de Observação Solar
26
Solar maximum is the term for the maximum in solar activity that takes place approximately every eleven years;solar minimum is the lowest point of solar activity. The last solar maximum was in 2001.Solar events can interact and interfere with each other, creating a very complex system. Their frequency varies with time. The smaller flares tend to follow the eleven year cycle and peak at several tens of flares per day. The largest flares usually occur only a few times during solar maximum. Sunspots increase with solar maximum, and are relatively rare during solar quiet times. Coronal holes do not last as long during solar maximum. Monthly averages of the sunspot numbers show that the number of sunspots visible on the Sun waxes, during solar maximum and wanes, solar minimum with an approximate 11-year cycle. Image courtesy of David Hathaway, NASA MSFC.

27
Mínimo de Maunder http://en.wikipedia.org/wiki/Maunder_Minimum
Descrição do ficheiro Changes in carbon-14 concentration in theEarth's atmosphere, which serves as a long term proxy of solar activity. Note the present day is on the left-hand side of this figure. This figure summarizes sunspot number observations. Since c. 1749, continuous monthly averages of sunspot activity have been available and are shown here as reported by the Solar Influences Data Analysis Center, World Data Center for the Sunspot Index, at the Royal Observatory of Belgium. These figures are based on an average of measurements from many different observatories around the world. Prior to 1749, sporadic observations of sunspots are available. These were compiled and placed on consistent monthly framework by Hoyt & Schatten (1998a, 1998b). The most prominent feature of this graph is the c. 11 year solar magnetic cycle which is associated with the natural waxing and waning of solar activity. On longer time scales, the sun has shown considerable variability, including the long Maunder Minimum when almost no sunspots were observed, the less severe Dalton Minimum, and increased sunspot activity during the last fifty years, known as the Modern Maximum. The causes for these variations are not well understood, but because sunspots and associated faculae affect the brightness of the sun, solarluminosity is lower during periods of low sunspot activity. It is widely believed that the low solar activity during the Maunder Minimum and earlier periods may be among the principal causes of the Little Ice Age. The Modern Maximum is between 1900 and 1950. [editar]Copyright This figure was prepared by Robert A. Rohde and is part of the Global Warming Art project.
. The most prominent feature of this graph is the c. 11 year solar magnetic cycle which is associated with the natural waxing and waning of solar activity. On longer time scales, the sun has shown considerable variability, including the long Maunder Minimum when almost no sunspots were observed, the less severe Dalton Minimum, and increased sunspot activity during the last fifty years, known as the Modern Maximum. The causes for these variations are not well understood, but because sunspots and associated faculae affect the brightness of the sun, solarluminosity is lower during periods of low sunspot activity. It is widely believed that the low solar activity during the Maunder Minimum and earlier periods may be among the principal causes of the Little Ice Age. The Modern Maximum is between 1900 and [editar]Copyright. This figure was prepared by Robert A. Rohde and is part of the Global Warming Art project.")
28
Diagrama Borboleta his graph shows the position of sunspots in the years from 1870 to Notice that the centerline, from left to right, is the equator of the Sun and that sunspots happen north and south, above and below this line. Courtesy of NASA. NASA's Marshall Space Flight Center Solar Cycle The number of sunspots on the Sun is not constant. In addition to the obvious variation caused by the Sun's rotation (sunspots disappear from view and then re-appear), over time new sunspot groups form and old ones decay and fade away. When viewed over short periods of time (a few weeks or months), this variation in the number of sunspots might seem to be random. However, observations over many years reveal a remarkable feature of the Sun: the number of sunspots varies in a periodic manner, usually described as the 11 year cycle (in actuality, the period varies, and has been closer to 10.5 years this century). The 11 year sunspot cycle is related to a 22 year cycle for the reversal of the Sun's magnetic field. In 1848 Johann Rudolf Wolf devised a method of counting sunspots on the solar disk called the Wolf number. Today the Wolf number (averaged from many observing sites) is used to keep track of the solar cycle. While the cycle has been relatively uniform this century, there have been large variations in the past. From about 1645 to 1715, a period known as the Maunder minimum, apparently few sunspots were present on the Sun. During the solar cycle,the migration of sunspots in latitude has a ``butterfly pattern.'' Although the number of sunspots is the most easily observed feature, essentially all aspects of the Sun and solar activity are influenced by the solar cycle. Because solar activity (such as coronal mass ejections) is more frequent at solar maximum and less frequent at solar minimum, geomagnetic activity also follows the solar cycle. Why is there a solar cycle? No one knows the answer to this question. A detailed explanation of the solar cycle is a fundamental physics problem still waiting to be solved
, over time new sunspot groups form and old ones decay and fade away. When viewed over short periods of time (a few weeks or months), this variation in the number of sunspots might seem to be random. However, observations over many years reveal a remarkable feature of the Sun: the number of sunspots varies in a periodic manner, usually described as the 11 year cycle (in actuality, the period varies, and has been closer to 10.5 years this century). The 11 year sunspot cycle is related to a 22 year cycle for the reversal of the Sun s magnetic field. In 1848 Johann Rudolf Wolf devised a method of counting sunspots on the solar disk called the Wolf number. Today the Wolf number (averaged from many observing sites) is used to keep track of the solar cycle. While the cycle has been relatively uniform this century, there have been large variations in the past. From about 1645 to 1715, a period known as the Maunder minimum, apparently few sunspots were present on the Sun. During the solar cycle,the migration of sunspots in latitude has a ``butterfly pattern. Although the number of sunspots is the most easily observed feature, essentially all aspects of the Sun and solar activity are influenced by the solar cycle. Because solar activity (such as coronal mass ejections) is more frequent at solar maximum and less frequent at solar minimum, geomagnetic activity also follows the solar cycle. Why is there a solar cycle No one knows the answer to this question. A detailed explanation of the solar cycle is a fundamental physics problem still waiting to be solved.")
29
Rotação diferencial These pictures show the Sun in ultraviolet "light". The left picture was at "solar min". The right picture was at "solar max". This UV wavelength (17.1 nanometers) helps scientists see certain parts of the Sun's atmosphere. The UV "light" is given off by iron at a temperature of one million kelvins. Images courtesy of SOHO (NASA & ESA).
 helps scientists see certain parts of the Sun s atmosphere. The UV light is given off by iron at a temperature of one million kelvins. Images courtesy of SOHO (NASA & ESA). id=193.")
30
http://www. newscientist. com/article/mg20627640
SUNSPOTS come and go, but recently they have mostly gone. For centuries, astronomers have recorded when these dark blemishes on the solar surface emerge, only for them to fade away again after a few days, weeks or months. Thanks to their efforts, we know that sunspot numbers ebb and flow in cycles lasting about 11 years. But for the past two years, the sunspots have mostly been missing. Their absence, the most prolonged for nearly a hundred years, has taken even seasoned sun watchers by surprise. "This is solar behaviour we haven't seen in living memory," says David Hathaway, a physicist at NASA's Marshall Space Flight Center in Huntsville, Alabama. The sun is under scrutiny as never before thanks to an armada of space telescopes. The results they beam back are portraying our nearest star, and its influence on Earth, in a new light. Sunspots and other clues indicate that the sun's magnetic activity is diminishing, and that the sun may even be shrinking. Together the results hint that something profound is happening inside the sun. The big question is what? The stakes have never been higher. Groups of sunspots forewarn of gigantic solar storms that can unleash a billion times more energy than an atomic bomb. Fears that these giant solar eruptions could create havoc on Earth, and disputes over the sun's role in climate change, are adding urgency to these studies. When NASA and the European Space Agency launched theSolar and Heliospheric Observatory almost 15 years ago, "understanding the solar cycle was not one of its scientific objectives", says Bernhard Fleck, the mission's project scientist. "Now it is one of the key questions." Sun behaving badly Sunspots are windows into the sun's magnetic soul. They form where giant loops of magnetism, generated deep inside the sun, well up and burst through the surface, leading to a localised drop in temperature which we see as a dark patch. Any changes in sunspot numbers reflect changes inside the sun. "During this transition, the sun is giving us a real glimpse into its interior," says Hathaway. When sunspot numbers drop at the end of each 11-year cycle, solar storms die down and all becomes much calmer. This "solar minimum" doesn't last long. Within a year, the spots and storms begin to build towards a new crescendo, the next solar maximum. What's special about this latest dip is that the sun is having trouble starting the next solar cycle. The sun began to calm down in late 2007, so no one expected many sunspots in But computer models predicted that when the spots did return, they would do so in force. Hathaway was reported as thinking the next solar cycle would be a "doozy": more sunspots, more solar storms and more energy blasted into space. Others predicted that it would be the most active solar cycle on record. The trouble was, no one told the sun. The first sign that the prediction was wrong came when 2008 turned out to be even calmer than expected. That year, the sun was spot-free 73 per cent of the time, an extreme dip even for a solar minimum. Only the minimum of 1913 was more pronounced, with 85 per cent of that year clear. As 2009 arrived, solar physicists looked for some action. They didn't get it. The sun continued to languish until mid-December, when the largest group of sunspots to emerge for several years appeared. Finally, a return to normal? Not really. Even with the solar cycle finally under way again, the number of sunspots has so far been well below expectations. Something appears to have changed inside the sun, something the models did not predict. But what? The flood of observations from space and ground-based telescopes suggests that the answer lies in the behaviour of two vast conveyor belts of gas that endlessly cycle material and magnetism through the sun's interior and out across the surface. On average it takes 40 years for the conveyor belts to complete a circuit (see diagram). When Hathaway's team looked over the observations to find out where their models had gone wrong, they noticed that the conveyor-belt flows of gas across the sun's surface have been speeding up since 2004. The circulation deep within the sun tells a different story. Rachel Howe and Frank Hill of the National Solar Observatory in Tucson, Arizona, have used observations of surface disturbances, caused by the solar equivalent of seismic waves, to infer what conditions are like within the sun. Analysing data from 2009, they found that while the surface flows had sped up, the internal ones had slowed to a crawl. These findings have thrown our best computer models of the sun into disarray. "It is certainly challenging our theories," says Hathaway, "but that's kinda nice." It is not just our understanding of the sun that stands to benefit from this work. The extent to which changes in the sun's activity can affect our climate is of paramount concern. It is also highly controversial. There are those who seek to prove that the solar variability is the major cause of climate change, an idea that would let humans and their greenhouse gases off the hook. Others are equally evangelical in their assertions that the sun plays only a minuscule role in climate change. If this dispute could be resolved by an experiment, the obvious strategy would be to see what happens when you switch off one potential cause of climate change and leave the other alone. The extended collapse in solar activity these past two years may be precisely the right sort of test, in that it has significantly changed the amount of solar radiation bombarding our planet. "As a natural experiment, this is the very best thing to happen," says Joanna Haigh, a climatologist at Imperial College London. "Now we have to see how the Earth responds." The climate link Mike Lockwood at the University of Reading, UK, may already have identified one response - the unusually frigid European winter of 2009/10. He hasstudied records covering data stretching back to 1650, and found that severe European winters are much more likely during periods of low solar activity(New Scientist, 17 April, p 6). This fits an emerging picture of solar activity giving rise to a small change in the global climate overall, yet large regional effects. Another example is the Maunder minimum, the period from 1645 to 1715 during which sunspots virtually disappeared and solar activity plummeted. If a similar spell of solar inactivity were to begin now and continue until 2100, it would mitigate any temperature rise through global warming by 0.3 °C on average, according to calculations by Georg Feulner and Stefan Rahmstorf of the Potsdam Institute for Climate Impact Research in Germany. However, something amplified the impact of the Maunder minimum on northern Europe, ushering in a period known as the Little Ice Age, when colder than average winters became more prevalent and the average temperature in Europe appeared to drop by between 1 and 2 °C. A corresponding boost appears to be associated with peaks in solar output. In 2008, Judith Lean of the Naval Research Laboratory in Washington DC published a study showing that high solar activity has a disproportionate warming influence on northern Europe (Geophysical Research Letters, vol 35, p L18701). So why does solar activity have these effects? Modellers may already be onto the answer. Since 2003, spaceborne instruments have been measuring the intensity of the sun's output at various wavelengths and looking for correlations with solar activity. The results point to the sun's emissions of ultraviolet light. "The ultraviolet is varying much, much, much more than we expected," says Lockwood. Ultraviolet light is strongly linked to solar activity: solar flares shine brightly in the ultraviolet, and it helps carry the explosive energy of the flares away into space. It could be particularly significant for the Earth's climate as ultraviolet light is absorbed by the ozone layer in the stratosphere, the region of atmosphere that sits directly above the weather-bearing troposphere. More ultraviolet light reaching the stratosphere means more ozone is formed. And more ozone leads to the stratosphere absorbing more ultraviolet light. So in times of heightened solar activity, the stratosphere heats up and this influences the winds in that layer. "The heat input into the stratosphere is much more variable than we thought," says Lockwood. Enhanced heating of the stratosphere could be behind the heightened effects felt by Europe of changes in solar activity. Back in 1996, Haigh showed that the temperature of the stratosphere influences the passage of the jet stream, the high-altitude river of air passing from west to east across Europe. Lockwood's latest study shows that when solar activity is low, the jet stream becomes liable to break up into giant meanders that block warm westerly winds from reaching Europe, allowing Arctic winds from Siberia to dominate Europe's weather. The lesson for climate research is clear. "There are so many weather stations in Europe that, if we are not careful, these solar effects could influence our global averages," says Lockwood. In other words, our understanding of global climate change could be skewed by not taking into account solar effects on European weather. Just as one mystery begins to clear, another beckons. Since its launch 15 years ago, the SOHO spacecraft has watched two solar minimums, one complete solar cycle, and parts of two other cycles - the one that ended in 1996 and the one that is just stirring. For all that time its VIRGO instrumenthas been measuring the total solar irradiance (TSI), the energy emitted by the sun. Its measurements can be stitched together with results from earlier missions to provide a 30-year record of the sun's energy output. What this shows is that during the latest solar minimum, the sun's output was per cent lower than during the previous lull. It might not sound like much, but it is a hugely significant result. We used to think that the sun's output was unwavering. That view began to change following the launch in 1980 of NASA's Solar Maximum Mission. Its observations show that the amount of energy the sun puts out varies by around 0.1 per cent over a period of days or weeks over a solar cycle. Shrinking star Despite this variation, the TSI has dipped to the same level during the three previous solar minima. Not so during this recent elongated minimum. Although the observed drop is small, the fact that it has happened at all is unprecedented. "This is the first time we have measured a long-term trend in the total solar irradiance," says Claus Fröhlich of the World Radiation Centrein Davos, Switzerland, and lead investigator for the VIRGO instrument. If the sun's energy output is changing, then its temperature must be fluctuating too. While solar flares can heat up the gas at the surface, changes in the sun's core would have a more important influence on temperature, though calculations show it can take hundreds of thousands of years for the effects to percolate out to the surface. Whatever the mechanism, the cooler the surface, the less energy there is to "puff up" the sun. The upshot of any dip in the sun's output is that the sun should also be shrinking. Observations suggest that it is - though we needn't fear a catastrophe like that depicted in the movie Sunshine just yet. Back in the 17th century French astronomer Jean Picard made his mark by measuring the sun's diameter. His observations were carried out during the Maunder minimum, and he obtained a result larger than modern measurements. Was this simply because of an error on Picard's part, or could the sun genuinely have shrunk since then? "There has been a lot of animated discussion, and the problem is not yet solved," says Gérard Thuillier of the Pierre and Marie Curie University in Paris, France. Observations with ground-based telescopes are not precise enough to resolve the question, due to the distorting effect of Earth's atmosphere. So the French space agency has designed a mission, aptly named Picard, to return precise measurements of the sun's diameter and look for changes. Frustratingly the launch, on a Russian Dnepr rocket, is mired in a political disagreement between Russia and neighbouring Kazakhstan. Until the dispute is resolved, the spacecraft must wait. Every day of delay means valuable data being missed as the sun takes steps, however faltering, into the next cycle of activity. "We need to launch now," says Thuillier. What the sun will do next is beyond our ability to predict. Most astronomers think that the solar cycle will proceed, but at significantly depressed levels of activity similar to those last seen in the 19th century. However, there is also evidence that the sun is inexorably losing its ability to produce sunspots (see "The sunspot forecast"). By 2015, they could be gone altogether, plunging us into a new Maunder minimum - and perhaps a new Little Ice Age. Of course, solar activity is just one natural source of climate variability. Volcanic eruptions are another, spewing gas and dust into the atmosphere. Nevertheless, it remains crucial to understand the precise changeability of the sun, and the way it influences the various regional patterns of weather on Earth. Climate scientists will then be able to correct for these effects, not just in interpreting modern measurements but also when attempting to reconstruct the climate stretching back centuries. It is only by doing so that we can reach an unassailable consensus about the sun's true level of influence on the Earth and its climate. The sunspot forecast Although sunspots are making a belated comeback after the protracted solar minimum, the signs are that all is not well. For decades, William Livingston at the National Solar Observatory in Tucson, Arizona, has been measuring the strength of the magnetic fields which puncture the sun's surface and cause the spots to develop. Last year, he and colleague Matt Penn pointed out that the average strength of sunspot magnetic fields has been sliding dramatically since 1995. If the trend continues, in just five years the field will have slipped below the threshold magnetic field needed for sunspots to form. How likely is this to happen? Mike Lockwood at the University of Reading, UK, has scoured historical data to look for similar periods of solar inactivity, which show up as increases in the occurrence of certain isotopes in ice cores and tree rings. He found 24 such instances in the last few thousand years. On two of those occasions, sunspots all but disappeared for decades. Lockwood puts the chance of this happening now at just 8 per cent. Only on one occasion did the sunspot number bounce back to record levels. In the majority of cases, the sun continued producing spots albeit at significantly depressed levels. It seems that the sunspot bonanza of last century is over.
. When Hathaway s team looked over the observations to find out where their models had gone wrong, they noticed that the conveyor-belt flows of gas across the sun s surface have been speeding up since The circulation deep within the sun tells a different story. Rachel Howe and Frank Hill of the National Solar Observatory in Tucson, Arizona, have used observations of surface disturbances, caused by the solar equivalent of seismic waves, to infer what conditions are like within the sun. Analysing data from 2009, they found that while the surface flows had sped up, the internal ones had slowed to a crawl. These findings have thrown our best computer models of the sun into disarray. It is certainly challenging our theories, says Hathaway, but that s kinda nice. It is not just our understanding of the sun that stands to benefit from this work. The extent to which changes in the sun s activity can affect our climate is of paramount concern. It is also highly controversial. There are those who seek to prove that the solar variability is the major cause of climate change, an idea that would let humans and their greenhouse gases off the hook. Others are equally evangelical in their assertions that the sun plays only a minuscule role in climate change. If this dispute could be resolved by an experiment, the obvious strategy would be to see what happens when you switch off one potential cause of climate change and leave the other alone. The extended collapse in solar activity these past two years may be precisely the right sort of test, in that it has significantly changed the amount of solar radiation bombarding our planet. As a natural experiment, this is the very best thing to happen, says Joanna Haigh, a climatologist at Imperial College London. Now we have to see how the Earth responds. The climate link. Mike Lockwood at the University of Reading, UK, may already have identified one response - the unusually frigid European winter of 2009/10. He hasstudied records covering data stretching back to 1650, and found that severe European winters are much more likely during periods of low solar activity(New Scientist, 17 April, p 6). This fits an emerging picture of solar activity giving rise to a small change in the global climate overall, yet large regional effects. Another example is the Maunder minimum, the period from 1645 to 1715 during which sunspots virtually disappeared and solar activity plummeted. If a similar spell of solar inactivity were to begin now and continue until 2100, it would mitigate any temperature rise through global warming by 0.3 °C on average, according to calculations by Georg Feulner and Stefan Rahmstorf of the Potsdam Institute for Climate Impact Research in Germany. However, something amplified the impact of the Maunder minimum on northern Europe, ushering in a period known as the Little Ice Age, when colder than average winters became more prevalent and the average temperature in Europe appeared to drop by between 1 and 2 °C. A corresponding boost appears to be associated with peaks in solar output. In 2008, Judith Lean of the Naval Research Laboratory in Washington DC published a study showing that high solar activity has a disproportionate warming influence on northern Europe (Geophysical Research Letters, vol 35, p L18701). So why does solar activity have these effects Modellers may already be onto the answer. Since 2003, spaceborne instruments have been measuring the intensity of the sun s output at various wavelengths and looking for correlations with solar activity. The results point to the sun s emissions of ultraviolet light. The ultraviolet is varying much, much, much more than we expected, says Lockwood. Ultraviolet light is strongly linked to solar activity: solar flares shine brightly in the ultraviolet, and it helps carry the explosive energy of the flares away into space. It could be particularly significant for the Earth s climate as ultraviolet light is absorbed by the ozone layer in the stratosphere, the region of atmosphere that sits directly above the weather-bearing troposphere. More ultraviolet light reaching the stratosphere means more ozone is formed. And more ozone leads to the stratosphere absorbing more ultraviolet light. So in times of heightened solar activity, the stratosphere heats up and this influences the winds in that layer. The heat input into the stratosphere is much more variable than we thought, says Lockwood. Enhanced heating of the stratosphere could be behind the heightened effects felt by Europe of changes in solar activity. Back in 1996, Haigh showed that the temperature of the stratosphere influences the passage of the jet stream, the high-altitude river of air passing from west to east across Europe. Lockwood s latest study shows that when solar activity is low, the jet stream becomes liable to break up into giant meanders that block warm westerly winds from reaching Europe, allowing Arctic winds from Siberia to dominate Europe s weather. The lesson for climate research is clear. There are so many weather stations in Europe that, if we are not careful, these solar effects could influence our global averages, says Lockwood. In other words, our understanding of global climate change could be skewed by not taking into account solar effects on European weather. Just as one mystery begins to clear, another beckons. Since its launch 15 years ago, the SOHO spacecraft has watched two solar minimums, one complete solar cycle, and parts of two other cycles - the one that ended in 1996 and the one that is just stirring. For all that time its VIRGO instrumenthas been measuring the total solar irradiance (TSI), the energy emitted by the sun. Its measurements can be stitched together with results from earlier missions to provide a 30-year record of the sun s energy output. What this shows is that during the latest solar minimum, the sun s output was per cent lower than during the previous lull. It might not sound like much, but it is a hugely significant result. We used to think that the sun s output was unwavering. That view began to change following the launch in 1980 of NASA s Solar Maximum Mission. Its observations show that the amount of energy the sun puts out varies by around 0.1 per cent over a period of days or weeks over a solar cycle. Shrinking star. Despite this variation, the TSI has dipped to the same level during the three previous solar minima. Not so during this recent elongated minimum. Although the observed drop is small, the fact that it has happened at all is unprecedented. This is the first time we have measured a long-term trend in the total solar irradiance, says Claus Fröhlich of the World Radiation Centrein Davos, Switzerland, and lead investigator for the VIRGO instrument. If the sun s energy output is changing, then its temperature must be fluctuating too. While solar flares can heat up the gas at the surface, changes in the sun s core would have a more important influence on temperature, though calculations show it can take hundreds of thousands of years for the effects to percolate out to the surface. Whatever the mechanism, the cooler the surface, the less energy there is to puff up the sun. The upshot of any dip in the sun s output is that the sun should also be shrinking. Observations suggest that it is - though we needn t fear a catastrophe like that depicted in the movie Sunshine just yet. Back in the 17th century French astronomer Jean Picard made his mark by measuring the sun s diameter. His observations were carried out during the Maunder minimum, and he obtained a result larger than modern measurements. Was this simply because of an error on Picard s part, or could the sun genuinely have shrunk since then There has been a lot of animated discussion, and the problem is not yet solved, says Gérard Thuillier of the Pierre and Marie Curie University in Paris, France. Observations with ground-based telescopes are not precise enough to resolve the question, due to the distorting effect of Earth s atmosphere. So the French space agency has designed a mission, aptly named Picard, to return precise measurements of the sun s diameter and look for changes. Frustratingly the launch, on a Russian Dnepr rocket, is mired in a political disagreement between Russia and neighbouring Kazakhstan. Until the dispute is resolved, the spacecraft must wait. Every day of delay means valuable data being missed as the sun takes steps, however faltering, into the next cycle of activity. We need to launch now, says Thuillier. What the sun will do next is beyond our ability to predict. Most astronomers think that the solar cycle will proceed, but at significantly depressed levels of activity similar to those last seen in the 19th century. However, there is also evidence that the sun is inexorably losing its ability to produce sunspots (see The sunspot forecast ). By 2015, they could be gone altogether, plunging us into a new Maunder minimum - and perhaps a new Little Ice Age. Of course, solar activity is just one natural source of climate variability. Volcanic eruptions are another, spewing gas and dust into the atmosphere. Nevertheless, it remains crucial to understand the precise changeability of the sun, and the way it influences the various regional patterns of weather on Earth. Climate scientists will then be able to correct for these effects, not just in interpreting modern measurements but also when attempting to reconstruct the climate stretching back centuries. It is only by doing so that we can reach an unassailable consensus about the sun s true level of influence on the Earth and its climate. The sunspot forecast. Although sunspots are making a belated comeback after the protracted solar minimum, the signs are that all is not well. For decades, William Livingston at the National Solar Observatory in Tucson, Arizona, has been measuring the strength of the magnetic fields which puncture the sun s surface and cause the spots to develop. Last year, he and colleague Matt Penn pointed out that the average strength of sunspot magnetic fields has been sliding dramatically since If the trend continues, in just five years the field will have slipped below the threshold magnetic field needed for sunspots to form. How likely is this to happen Mike Lockwood at the University of Reading, UK, has scoured historical data to look for similar periods of solar inactivity, which show up as increases in the occurrence of certain isotopes in ice cores and tree rings. He found 24 such instances in the last few thousand years. On two of those occasions, sunspots all but disappeared for decades. Lockwood puts the chance of this happening now at just 8 per cent. Only on one occasion did the sunspot number bounce back to record levels. In the majority of cases, the sun continued producing spots albeit at significantly depressed levels. It seems that the sunspot bonanza of last century is over.")
31
Granulações células que cobrem superfície solar 1000 km de diâmetro
vida média de 20min São o topo das colunas de convecção! Orange Sun Oozing Credit: Bruno Sánchez-Andrade Nuño et al. (IAG & MPS, Germany) Explanation: The Sun's surface keeps changing. Click the central arrow and watch how the Sun's surface oozes during a single hour. The Sun's photosphere has thousands of bumps called granules and usually a few dark depressions called sunspots. The above time-lapse movie centered on Sunspot 875 was taken last year by the Vacuum Tower Telescope in the Canary Islands of Spain using adaptive optics to resolve details below 500 kilometers across. Each of the numerous granules is the size of an Earth continent, but much shorter lived. A granule slowly changes its shape over an hour, and can even completely disappear. Hot hydrogen gas rises in the bright center of a granule, and falls back into the Sun along a dark granule edge. The above movie and similar movies allow solar scientists to study how granules and sunspots evolve as well as how magnetic sunspot regions produce powerful solar flares.
 Explanation: The Sun s surface keeps changing. Click the central arrow and watch how the Sun s surface oozes during a single hour. The Sun s photosphere has thousands of bumps called granules and usually a few dark depressions called sunspots. The above time-lapse movie centered on Sunspot 875 was taken last year by the Vacuum Tower Telescope in the Canary Islands of Spain using adaptive optics to resolve details below 500 kilometers across. Each of the numerous granules is the size of an Earth continent, but much shorter lived. A granule slowly changes its shape over an hour, and can even completely disappear. Hot hydrogen gas rises in the bright center of a granule, and falls back into the Sun along a dark granule edge. The above movie and similar movies allow solar scientists to study how granules and sunspots evolve as well as how magnetic sunspot regions produce powerful solar flares.")
32
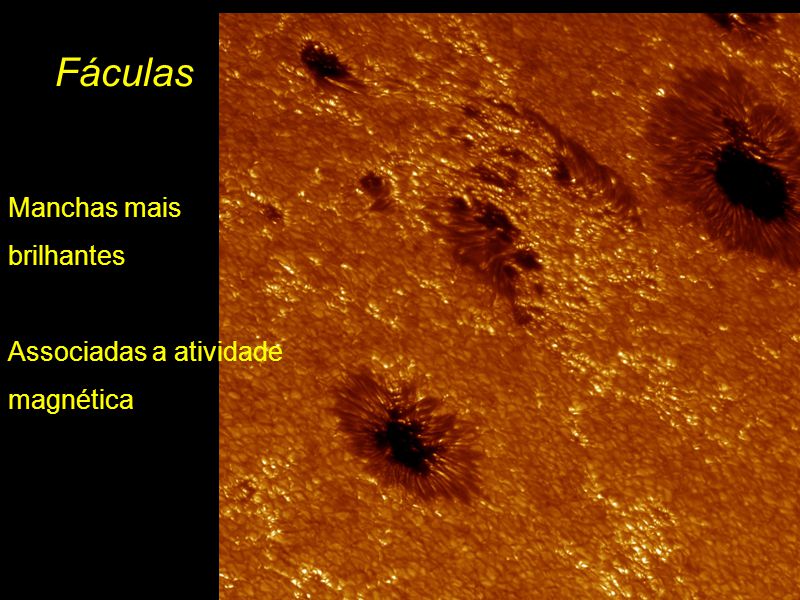
Fáculas Manchas mais brilhantes Associadas a atividade magnética
33
Luc Viatour / www.Lucnix.be
Cromosfera This illustration was made by Luc ViatourPlease credit this with : Luc Viatour / the immediate vicinity of the image. A link to my website is much appreciated but not mandatory. An to Viatour Luc would be appreciated too. Do not copy this image illegally by ignoring the terms of the license below, as it is not in the public domain. If you would like special permission to use, license, or purchase the image please contact me Viatour Luc to negotiate terms. More free pictures in my personal gallery Luc Viatour /

34
Filamentos e Praias Filamentos:
Linhas escuras nuvens mais frias e mais densas Sustentado sobre a superfície por campos magnéticos Filaments and Plage Filaments are dark, thread-like features seen in the red light of hydrogen (H-alpha). These are dense, somewhat cooler, clouds of material that are suspended above the solar surface by loops of magnetic field. Plage, the French word for beach, are bright patches surrounding sunspots that are best seen in H-alpha. Plage are also associated with concentrations of magnetic fields and form a part of the network of bright emissions that characterize the chromosphere. Praias: Regiões brilhantes ao redor de manchas Associadas a concentrações de campo magnético
. These are dense, somewhat cooler, clouds of material that are suspended above the solar surface by loops of magnetic field. Plage, the French word for beach, are bright patches surrounding sunspots that are best seen in H-alpha. Plage are also associated with concentrations of magnetic fields and form a part of the network of bright emissions that characterize the chromosphere. Praias: Regiões brilhantes ao redor de manchas. Associadas a concentrações de campo magnético.")
35
Espículos Erupções na forma de jato Diâmetro de 700 km
Altura de 7 mil km Tempo de vida de alguns minutos Ejeção de matéria para a Coroa com velocidades de 20 a 30 km/s

36
Espículos Read more: Cloud-like structures in the background above the Sun churn from the passage of magnetic ripples called Alfvén waves, which may be responsible for the extreme heat of the Sun's corona. Vertical jets called spicules dance closer to the Sun's surface.

37
Atmosfera externa solar
Coroa Atmosfera externa solar SOHO-EIT image in resonance lines of eleven times ionized iron (Fe XII) at 195 Angstroms in the extreme ultraviolet showing the solar corona at a temperature of about 1 million K. This image was recorded on 11 September It is dominated by two large active region systems, composed of numerous magnetic loops.
 at 195 Angstroms in the extreme ultraviolet showing the solar corona at a temperature of about 1 million K. This image was recorded on 11 September It is dominated by two large active region systems, composed of numerous magnetic loops.")
38
Plumas Pluma POLAR PLUMEBright structure of out-flowing gas which occur along magnetic field lines in coronal holes. These field lines extend into the solar system. Although plumes usually occur at the poles, they can appear anywhere there is a coronal hole. more!

39
Proeminências Nuvens densas de matéria suspensas para além do limbo solar Quiescentes: dura de dias a semanas Explosivas: dura de minutos a horas Acompanham linhas magnéticas Também fazem parte da Coroa Large, eruptive prominence in He II at 304Å, with an image of the Earth added for size comparison. This prominence from 24 July 1999 is particularly large and looping, extending over 35 Earths out from the Sun. Erupting prominences (when Earthward directed) can affect communications, navigation systems, even power grids, while also producing auroras visible in the night skies.
 can affect communications, navigation systems, even power grids, while also producing auroras visible in the night skies.")
40
Proeminências http:////www.youtube.com/watch?v=Lmm3J0WAres
Enviado por SDOmission2009 em 22/04/2010 AIA caught this beautiful prominence eruption only a few days after its doors were opened. The movie wobbles at the end because AIA's image stabilization system wasn't fully activated yet. Without the full stabilization capability, AIA would not be able to see the Sun at such high resolution. The actual wobble was extremely small - imagine a period in a newspaper seen from 100 meters away. Now move that period over a couple of words.

41
15-16 Janeiro 2012 The upper one of a pair of new, solar active regions that just rotated into view of SDO offered a beautiful profile view of cascading loops spiraling above it (Jan , 2012) following a solar flare eruption. These loop structures are made of superheated plasma, just one of which is the size of several Earths. With its ability to capture the Sun in amazing detail, SDO observed it all in extreme ultraviolet light. This particular video clip used an image every five minutes to present the motion. Note all of the other spurts and minor bursts from both regions during almost two days.
 following a solar flare eruption. These loop structures are made of superheated plasma, just one of which is the size of several Earths. With its ability to capture the Sun in amazing detail, SDO observed it all in extreme ultraviolet light. This particular video clip used an image every five minutes to present the motion. Note all of the other spurts and minor bursts from both regions during almost two days. v=item&id=83.")
42
23/Janeiro/2012 http://www.youtube.com/watch?v=-ilr8p13A2o
The Chinese New Year certainly started with a bang this morning. At approx. 04:00 UT a strong and long duration M8.7-class solar flare exploded from Active Region 1402. NASA SDO captured this event and thanks to ESA/NASA SOHO and NASA STEREO Behind spacecrafts, we have also learned of a very quick moving Coronal Mass Ejection. The CME is traveling at approx. 2,200 km per second and the Goddard Space Weather Lab predicts the arrival of this CME on earth to be January 24, 2012 at approx. 14:18 UT (+/- 7 hours). It also shows that Mars will get hit too, several hours after Earth. These kinds of events can cause problems for spacecrafts in geosynchronous, polar and other orbits passing could be affected by the cloud's arrival. In addition, strong geomagnetic storms are possible, so high-latitude sky watchers should be alert for Aurorae. Credit: NASA SDO
. It also shows that Mars will get hit too, several hours after Earth. These kinds of events can cause problems for spacecrafts in geosynchronous, polar and other orbits passing could be affected by the cloud s arrival. In addition, strong geomagnetic storms are possible, so high-latitude sky watchers should be alert for Aurorae. Credit: NASA SDO.")
43
Observação Importante!
Nunca olhe diretamente para o Sol!!!

44
HMI Continuum _0000_hmiigr_1024.jpg

45
HMI "most recent" images A directory of NRT jpeg image files and animations for the continuum intensity, line-of-sight magnetograms, and Dopplergrams. These files can be retrieved with ftp or wget commands, allowing the retrieval to be automated.

46
http://sdo. gsfc. nasa. gov/assets/gallery/preview/multiwave_zm_hmi
This HMI movie shows a sunspot region and the surrounding magnetic field. White = magnetic field pointing out of the Sun (North), black regions = into the Sun (South). Notice the tiny flux elements that cover the rest of the Sun; an example of HMI's extraordinary capabilities. These magnetic fields form the basis for the coronal loops and prominences you see in the AIA images. Search Tag(s): hmi, magnetogram
, black regions = into the Sun (South). Notice the tiny flux elements that cover the rest of the Sun; an example of HMI s extraordinary capabilities. These magnetic fields form the basis for the coronal loops and prominences you see in the AIA images. Search Tag(s): hmi, magnetogram.")
47
As befits the beginning of growing season around here, the Sun produced a real growth spurt in the size of two sunspots in just 2.5 days (Apr ). The area of each of the spots AR1718 and AR1719) began to spread as its core grew as well. Now both spots are facing towards Earth and could produce space weather. The have produced smaller flares already and have the magnetic field configuration to produce larger ones. We will be keeping a close eye on these two. Credit: Solar Dynamics Observatory/NASA. Search Tag(s): intensitygram, sunspot, active region, flare, hmi 8 a 10 de Abril de 2013
. The area of each of the spots AR1718 and AR1719) began to spread as its core grew as well. Now both spots are facing towards Earth and could produce space weather. The have produced smaller flares already and have the magnetic field configuration to produce larger ones. We will be keeping a close eye on these two. Credit: Solar Dynamics Observatory/NASA. Search Tag(s): intensitygram, sunspot, active region, flare, hmi. 8 a 10 de Abril de")
48
http: The Sun doubled its sunspot groups over a little more than 3 days (Mar , 2013) and strung most of them in a jagged row. The close-up video shows a pair of sunspot groups emerging in just over a few hours on the 11th, then populating their surroundings with lots of mini-spots. Another larger sunspot rotated into view also mid-way into the 11th. Sunspots, cooler and darker regions of intense magnetism, can last from hours to weeks and are often the source of solar storms. We'll see what these spots have in store for us over the next week or so. Credit: Solar Dynamics Observatory/NASA. Search Tag(s): intensitygram, magnetogram, sunspot, hmi //sdo.gsfc.nasa.gov/gallery/main/item/186 11 a 14 de Março de 2013
 and strung most of them in a jagged row. The close-up video shows a pair of sunspot groups emerging in just over a few hours on the 11th, then populating their surroundings with lots of mini-spots. Another larger sunspot rotated into view also mid-way into the 11th. Sunspots, cooler and darker regions of intense magnetism, can last from hours to weeks and are often the source of solar storms. We ll see what these spots have in store for us over the next week or so. Credit: Solar Dynamics Observatory/NASA. Search Tag(s): intensitygram, magnetogram, sunspot, hmi. //sdo.gsfc.nasa.gov/gallery/main/item/ a 14 de Março de")
49
The underlying magnetic structure of the Sun and how it appears above its surface can be revealed by combining different images of the Sun taken at almost the same time (June 7, 2013). We begin with a magnetic image of the Sun, where darker and lighter tones indicate the stronger north and south polarity of active regions. When we blend this image into an extreme ultraviolet image of the Sun, arcs of magnetic field lines can be seen rising out and returning to these same active regions. Lastly, because scientists have learned how to illustrate the magnetic field lines, we can view their projections. The result is a brief, visual lesson in solar magnetism. Credit: Solar Dynamics Observatory. Search Tag(s): hmi, magnetogram, 171 7 de Junho de 2013
. We begin with a magnetic image of the Sun, where darker and lighter tones indicate the stronger north and south polarity of active regions. When we blend this image into an extreme ultraviolet image of the Sun, arcs of magnetic field lines can be seen rising out and returning to these same active regions. Lastly, because scientists have learned how to illustrate the magnetic field lines, we can view their projections. The result is a brief, visual lesson in solar magnetism. Credit: Solar Dynamics Observatory. Search Tag(s): hmi, magnetogram, de Junho de")
50
FIM

Apresentações semelhantes


.>")


 de distância da Via Láctea.>")


