Carregar apresentação
A apresentação está carregando. Por favor, espere

1
Risco cardiovascular modificavel
Rodrigo Durante Soares Conselheiro CREMESP gestao Pos-graduando Incor - HCFMUSP – Coronariopatias Chefe da equipe de avaliacao perioperatoria do IOT - HCFMUSP

2
Risco cardiovascular: modificavel ?

3
Distribuição global de causas de mortes - 2001 / Total de morte: 56
Fonte: Portal da Hipertensão WHO, World Health Report 2001

4
Doenças Crônicas Não Transmissíveis Brasil - 2002
Fonte: Portal da Hipertensão WHO

5
Risco Cardiovascular Modificavel
Sindrome Metabolica Dislipidemia Diabetes/Pre-Diabetes Hipertens’ao Arterial

6
SÍNDROME METABÓLICA Prevalência: 20 a 25% na população normal.
A redução da ação insulínica (resistencia) pode estar acompanhada de um grupo de alterações metabólicas e cardiovasculares. HAS; hipertrigliceridemia; redução do HDL-colesterol; intolerância aos carboidratos, obesidade central; hiperuricemia e doença cardiovascular SBD, 2006
 pode estar acompanhada de um grupo de alterações metabólicas e cardiovasculares. HAS; hipertrigliceridemia; redução do HDL-colesterol; intolerância aos carboidratos, obesidade central; hiperuricemia e doença cardiovascular. SBD,")
7
SÍNDROME METABÓLICA Nível de Definição Fatores de Risco (3)
Circunferência cintura (cm) Homen: >102; mulher: >88 Obesidade Abdominal <40 (Homem); <50 (mulher) HDL-C (mg/dl) 110 mg/dl Glicemia de jejum 130/85 mm Hg Pressão arterial 150 mg/dl Triglicérides Nível de Definição Fatores de Risco (3) Expert Panel. JAMA 2001;285:
 Homen: >102; mulher: >88. Obesidade Abdominal. <40 (Homem); <50 (mulher) HDL-C (mg/dl) 110 mg/dl. Glicemia de jejum. 130/85 mm Hg. Pressão arterial. 150 mg/dl. Triglicérides. Nível de Definição. Fatores de Risco (3) Expert Panel. JAMA 2001;285:")
8
OUTROS FATORES QUE CONTRIBUEM PARA O
DESENVOLVIMENTO DA SÍNDROME METABÓLICA ALIMENTAÇÃO Quantidade de açúcar ingerida Alto índice glicêmico Aumento consumo de fibras Menor Resistência à insulina Resistência à insulina Framingham Offspring Study; Diabetes Care 2004;

9
ÍNDICE GLICÊMICO DOS ALIMENTOS
Baixo (<60) Índice glicêmico Alto (>85) Índice glicêmico Moderado (60-85)
 Índice glicêmico. Alto. (>85) Índice glicêmico. Moderado. (60-85)")
10
Pão branco-101 Glicose-138 Alimentos com IG alto (>85)
Alimentos com IG moderado (60-85) Alimentos com IG baixo (<60) Pão branco -101 Bolos – 87 Crackers - 99 All Bran – 60 Musli – 80 Aveia – 78 Leite integral – 39 Leite desnatado – 46 Iogurte com açúcar - 48 Biscoitos – 90 Sorvete -85 Banana – 83 Kiwi – 75 Iogurte com adoçante – 27 Maçã – 52 Corn-flakes – 119 Mingau de aveia – 87 Manga – 80 Laranja – 62 Suco de maçã – 58 Damasco seco – 44 Trigo cozido – 105 Farinha de trigo – 99 Suco de laranja – 74 Pêssego enlatado – 67 Pêra – 54 Lentilhas - 38 Cuscus – 93 Milho – 98 Tapioca – 115 Arroz branco – 81 Arroz integral – 79 Arroz parboilizado – 68 Soja (feijão) – 23 Spaguete – 59 Batata cozida – 121 Batata frita – 107 Batata doce - 88 Feijão cozido – 69 Inhame – 73 Amendoim – 23 Sopa de tomate – 54 Mel – 104 Glicose – 138 Sacarose – 87 Chocolate – 84 Pipoca – 79 Lactose – 65 Frutose – 32 Sopa de feijão – 84 Ervilhas - 68 Glicose-138 Pão branco-101 FAO/OMS Carbohydrates in Human Nutrition
 Alimentos com IG baixo (<60) Pão branco Bolos – 87. Crackers All Bran – 60. Musli – 80. Aveia – 78. Leite integral – 39. Leite desnatado – 46. Iogurte com açúcar Biscoitos – 90. Sorvete -85. Banana – 83. Kiwi – 75. Iogurte com adoçante – 27. Maçã – 52. Corn-flakes – 119. Mingau de aveia – 87. Manga – 80. Laranja – 62. Suco de maçã – 58. Damasco seco – 44. Trigo cozido – 105. Farinha de trigo – 99. Suco de laranja – 74. Pêssego enlatado – 67. Pêra – 54. Lentilhas Cuscus – 93. Milho – 98. Tapioca – 115. Arroz branco – 81. Arroz integral – 79. Arroz parboilizado – 68. Soja (feijão) – 23. Spaguete – 59. Batata cozida – 121. Batata frita – 107. Batata doce Feijão cozido – 69. Inhame – 73. Amendoim – 23. Sopa de tomate – 54. Mel – 104. Glicose – 138. Sacarose – 87. Chocolate – 84. Pipoca – 79. Lactose – 65. Frutose – 32. Sopa de feijão – 84. Ervilhas Glicose-138. Pão branco-101. FAO/OMS Carbohydrates in Human Nutrition.")
11
Risco Cardiovascular Modificavel
Sindrome Metabolica Dislipidemia Diabetes/Pre-Diabetes Hipertens’ao Arterial

12
Agregação das plaquetas
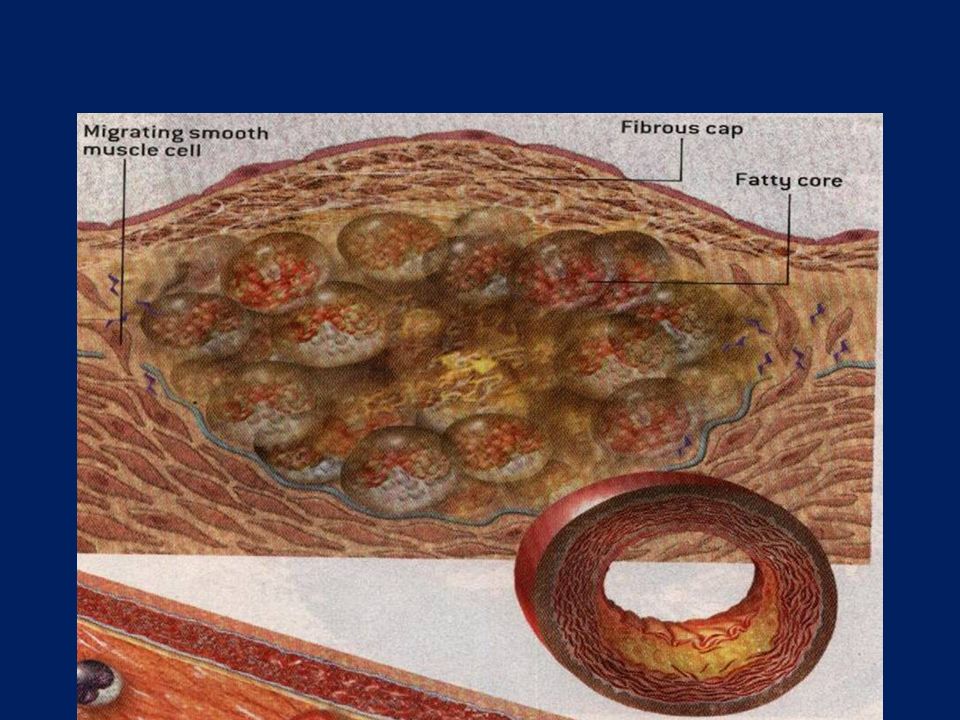
Placa de Ateroma Acumulo de lipídios modificados Ativação das células endoteliais Migração das células inflamatórias Ativação das células inflamatórias Recrutamento das células musculares lisas Proliferação e síntese da matriz Formação da capa fibrosa Ruptura da placa Agregação das plaquetas Trombose

18
Determinações Laboratoriais
Determinações da coleta: Estilo de vida habitual nas últimas três semanas Jejum de 12-24hs, imprescindível para valores de TG e HDL-C Evitar exercício três horas antes da coleta Esperar até três semanas em caso de doenças leves, mudanças dietéticas recentes Esperar até três meses em caso de doença grave ou procedimento cirúrgico

19
Dislipidemias Secundárias

20
Dislipidemias Secundárias

21
HDL LDL 100 –129 Subótimo 130 –159 Limite do alto 160 –189 Alto
NCEP 2001 LDL < 100 Ótimo 100 –129 Subótimo 130 –159 Limite do alto 160 –189 Alto 190 Muito alto HDL < Baixo > Alto

22
METAS DE LDL-C E TRATAMENTO DE ACORDO COM CATEGORIAS DE RISCO
190 (160–189: optional) 160 <160 0–1 Fatores de risco 130 <130 2+ Fatores de Risco 130 (100–129: optional) 100 <100 CHD ou Equivalente LDL para iniciar drogas LDL para iniciar IEV Meta de LDL (mg/dL) Categoria de Risco 160
 160. <160. 0–1 Fatores de risco. 130. < Fatores de Risco. 130 (100–129: optional) 100. <100. CHD ou Equivalente. LDL para iniciar drogas. LDL para iniciar IEV. Meta de LDL (mg/dL) Categoria de Risco. 160.")
23
PARADIGMA DAS METAS x NIVEIS ADEQUADOS AO RISCO CV INDIVIDUAL
VALORES PRE-DETERMINADOS DE NORMAL E ALTERADO x ??????????????????

24
Avaliação clínica: achados no exame clínico indicativos de alto risco ou da necessidade de exames laboratoriais para determinar o risco CV Indicadores de alto risco: - LOA infarto do miocárdio prévio, derrame cerebral prévio, angina de peito, ICC de etiologia isquêmica, doença vascular periférica, doença renal crônica, etc Homens 45 anos e mulheres 55 anos requerem exames laboratoriais para estimar mais precisamente o risco cardiovascular Indivíduos mais jovens que já apresentam um ou mais fatores de risco devem passar para avaliação clínico-laboratorial subseqüente.

25
Escore de Risco de Framingham

26
Metas adequadas ao risco CV individual
Alto risco ( > 20% eventos em 10 anos): LDL < 100 ( < 70 em casos selecionados) e AAS se nao houver contra-indicacoes Baixo risco ( <10% eventos em 10 anos): LDL < 160 e nao ha indicacao de uso de AAS Risco Intermediario ( 10 – 20% em 10 anos ): LDL < 130 ( <100 em casos selecionados ) e indicacao de AAS apenas em casos selecionados
: LDL < 100 ( < 70 em casos selecionados) e AAS se nao houver contra-indicacoes. Baixo risco ( <10% eventos em 10 anos): LDL < 160 e nao ha indicacao de uso de AAS. Risco Intermediario ( 10 – 20% em 10 anos ): LDL < 130 ( <100 em casos selecionados ) e indicacao de AAS apenas em casos selecionados.")
27
Tratamento de Dislipidemias
LDL-C elevado Terapias de Mudanças Estilo de Vida Drogas Treatment of hyperlipidemia Statins have been and remain the drugs of first choice for lowering LDL-C. They lower LDL-C more effectively than other currently available agents, and they reduce CHD risk. Because of their LDL-C–lowering efficacy, they are able to achieve LDL-C treatment goals in the majority of patients, regardless of their risk category. In fact, the more potent the LDL-C–lowering efficacy of the statin, the greater the percentage of patients who will achieve their LDL-C goal. Statins are also remarkably safe as will be described below. About 5–10% of patients will not be able to tolerate a statin and so the only alternative agents for lowering LDL-C are a bile acid resin and niacin. These drugs are not as effective in lowering LDL-C and cause bothersome side effects which make patient compliance a problem. However, they are effective in reducing CHD risk and in the majority of patients can be successfully taken. Reference: Expert Panel on Detection, Evaluation, and Treatment of High Blood Cholesterol in Adults. Executive summary of the third report of the National Cholesterol Education Program (NCEP) Expert Panel on Detection, Evaluation, and Treatment of High Blood Cholesterol in Adults (Adult Treatment Panel III). JAMA 2001;285: Terapia de escolha: Estatinas Alternativa: Resina ou niacina Expert Panel on Detection, Evaluation, and Treatment of High Blood Cholesterol in Adults. JAMA 2001;285:
 Expert Panel on Detection, Evaluation, and Treatment of High Blood Cholesterol in Adults (Adult Treatment Panel III). JAMA 2001;285: Terapia de escolha: Estatinas. Alternativa: Resina ou niacina. Expert Panel on Detection, Evaluation, and Treatment of High Blood Cholesterol in Adults. JAMA 2001;285:")
28
Efeitos dos AG em lipoproteinas
Todos os AG aumentam HDL em relação a CH SAT aumentam LDL e HDL PI em relação a SAT = LDL e HDL MI em relação a SAT = LDL e HDL PORÉM, DEVEM SER MANTIDOS DENTRO DAS PROPORÇÕES RECOMENDADAS

29
EFEITO DE ADJUNTOS ALIMENTARES
Mudança estilo de vida em pacientes LDL-C = 160 Componente Dietético LDL-C (mg/dL) Redução de gordura saturada/colesterol –12 Fibras Viscosas (10–25 g/d) –8 Estanpois/Esteróis de Plantas (2 g/d) –16 Total –36 mg/dl (22,5%) Walden CE et al. Arterioscler Thromb Vasc Biol 1997;17: Jenkins DJ et al. Curr Opin Lipidol 2000;11:49-56. Cato N. Stanol meta-analysis. Personal communication, 2000.
 Redução de gordura saturada/colesterol. –12. Fibras Viscosas (10–25 g/d) –8. Estanpois/Esteróis de Plantas (2 g/d) –16. Total. –36 mg/dl. (22,5%) Walden CE et al. Arterioscler Thromb Vasc Biol 1997;17: Jenkins DJ et al. Curr Opin Lipidol 2000;11: Cato N. Stanol meta-analysis. Personal communication,")
30
Álcool: Doses moderadas de álcool aumentam HDLc
Doses altas de álcool aumentam TG leve moderada alta

31
Risco Cardiovascular Modificavel
Sindrome Metabolica Dislipidemia Diabetes/Pre-Diabetes Hipertensao Arterial

32
O que e Pre-diabetes? Pre-diabetes e uma condicao medica onde o nivel de glicose sanguinea e > que o normal mas nao suficiente para ser chamado de DM Esta condicao aumenta o risco de DM2 e o risco cardiovascular Muitos individuos apresentam Pre-diabetes antes de desenvolverem o DM2 Pre-diabetes means blood glucose levels are higher than normal but not high enough to be diagnosed with diabetes. Pre-diabetes raises the risk of developing type 2 diabetes and cardiovascular disease, including heart disease and stroke. Prior to developing type 2 diabetes, people almost always have pre-diabetes. Reference National Institute of Diabetes and Digestive and Kidney Diseases. National Diabetes Statistics fact sheet: General information and national estimates on diabetes in the United States, Bethesda, MD: U.S. Department of Health and Human Services, National Institutes of Health, 2008. NIDDK, National Diabetes Statistics

33
O que e Pre-diabetes? A maioria das pessoas com pre-diabetes desenvolve diabetes dentro de 10 anos Pessoas com pre-diabetes sao identificadas por ter um teste de screening com Glicemia de jejum alterada, TTGO com intolerancia ou A1C de 5.7% - 6.4% Progressao para o DM2 nao e inevitavel Studies indicate that most people with pre-diabetes develop type 2 diabetes within 10 years. People with pre-diabetes are identified by when they have a screening test for diabetes – the screening test shows that they have impairedfasting glucose (IFG) impaired glucose tolerance (IGT) or an A1C of 5.7 to 6/4% IFG is defined as a glucose level of 100 to 125 mg per dL after an overnight 8 to 12 hour fast. IGT is defined as a two-hour glucose level of 140 to 199 mg per dL after a person drinks a 75-gram glucose solution following an overnight 8 to 12 hour fast. It is important to note that progression to type 2 diabetes among people with pre-diabetes is not inevitable – as was found in the Diabetes Prevention Program. Reference National Institute of Diabetes and Digestive and Kidney Diseases. National Diabetes Statistics fact sheet: General information and national estimates on diabetes in the United States, Bethesda, MD: U.S. Department of Health and Human Services, National Institutes of Health, 2008. NIDDK, National Diabetes Statistics
 impaired glucose tolerance (IGT) or an A1C of 5.7 to 6/4% IFG is defined as a glucose level of 100 to 125 mg per dL after an overnight 8 to 12 hour fast. IGT is defined as a two-hour glucose level of 140 to 199 mg per dL after a person drinks a 75-gram glucose solution following an overnight 8 to 12 hour fast. It is important to note that progression to type 2 diabetes among people with pre-diabetes is not inevitable – as was found in the Diabetes Prevention Program. Reference. National Institute of Diabetes and Digestive and Kidney Diseases. National Diabetes Statistics fact sheet: General information and national estimates on diabetes in the United States, Bethesda, MD: U.S. Department of Health and Human Services, National Institutes of Health, NIDDK, National Diabetes Statistics")
34
Fatores de risco: Diabetes
Id > 45a IMC > 25 HAS DLP HF DM2 Historia pessoal de diabetes gestacional Historia de doenca vascular Sinais de Resistencia a Insulina (SOMP e acanthosisnigricans) Sedentarismo Many factors make a person at higher risk for diabetes. The risk for type 2 diabetes increases with age. People who are overweight—defined as a body mass index (BMI) of ≥25 (≥ 23 if Asian American or ≥ 26 if Pacific Islander)—are also at an increased risk for diabetes. A blood pressure measurement of > or = 140/90 mm/Hg. Abnormal lipid levels – HDL cholesterol < 35mg/dL; triglyceride level ≥ 250 mg/dL. A family history of diabetes – first degree relative with diabetes. Race/ethnicity – African Americans, Hispanic/Latino Americans, American Indians, and Asian Americans and Pacific Islanders are at particularly high risk for pre-diabetes and diabetes. A history of gestational diabetes OR giving birth to baby greater than 9 lbs. A history of vascular disease. Signs of insulin resistance such as acanthosis nigricans and PCOS. PRE-DIABETES: Impaired Glucose Tolerance or Impaired Fasting Glucose or an A1c of 5.7 – 6.4% on previous testing. An inactive lifestyle – being physically active less than 3 times a week. Reference American Diabetes Association: Clinical Practice Recommendations-Standards of Medical Care in Diabetes. Diabetes Care 2010; 33 (Suppl. 1):S11-61. American Diabetes Association. Diabetes Care 2008; 31;(Suppl.1):S12-54.
 Sedentarismo. Many factors make a person at higher risk for diabetes. The risk for type 2 diabetes increases with age. People who are overweight—defined as a body mass index (BMI) of ≥25 (≥ 23 if Asian American or ≥ 26 if Pacific Islander)—are also at an increased risk for diabetes. A blood pressure measurement of > or = 140/90 mm/Hg. Abnormal lipid levels – HDL cholesterol < 35mg/dL; triglyceride level ≥ 250 mg/dL. A family history of diabetes – first degree relative with diabetes. Race/ethnicity – African Americans, Hispanic/Latino Americans, American Indians, and Asian Americans and Pacific Islanders are at particularly high risk for pre-diabetes and diabetes. A history of gestational diabetes OR giving birth to baby greater than 9 lbs. A history of vascular disease. Signs of insulin resistance such as acanthosis nigricans and PCOS. PRE-DIABETES: Impaired Glucose Tolerance or Impaired Fasting Glucose or an A1c of 5.7 – 6.4% on previous testing. An inactive lifestyle – being physically active less than 3 times a week. Reference. American Diabetes Association: Clinical Practice Recommendations-Standards of Medical Care in Diabetes. Diabetes Care 2010; 33 (Suppl. 1):S American Diabetes Association. Diabetes Care 2008; 31;(Suppl.1):S")
35
Quando considerar teste para Diabetes e Pre-Diabetes
Id >45a Adulto <45a c/ pelo menos 1 FR DM --: Glicemia de Jejum ou A1C ou TTGO 75g Repetir o teste a cada 3 anos Patients with should be assessed for diabetes and pre-diabetes – if a person is found to have pre-diabetes they need to be monitored for disease progression. People at high risk should be identified based upon known risk factors. Testing should be considered if a person is: Age 45 or older Overweight adult with any other risk factor. If results are acceptable, testing should be repeated at 3-year intervals. An A1C test OR Fasting Plasma Glucose Test (FPG) OR a 2-hour plasma glucose post 75-g oral glucose challenge after an overnight 8 to 12 hour fast should be obtained. Reference American Diabetes Association. Standards of Medical Care in Diabetes. Diabetes Care 2010; 33 (Suppl. 1):S11-61. American Diabetes Association. Diabetes Care 2008; 31;(Suppl.1):S12-54.
 OR a 2-hour plasma glucose post 75-g oral glucose challenge after an overnight 8 to 12 hour fast should be obtained. Reference. American Diabetes Association. Standards of Medical Care in Diabetes. Diabetes Care 2010; 33 (Suppl. 1):S American Diabetes Association. Diabetes Care 2008; 31;(Suppl.1):S")
36
Criterios Diagnosticos Pre-diabetes e Diabetes
A1C Glicemia Jejum TTGO 75g Aceitavel < 100 mg/dl < 140 mg/dl Pre-diabetes 5.7% - 6.4% mg/dl mg/dl Diabetes ≥ 6.5% > ou = 126 mg/dl > ou = 200 mg/dl This table shows the diagnostic criteria for diabetes and criteria for pre-diabetes. We can now use the A1c test as a screening test for diabetes now. The A1C test measures a person’s average blood glucose over a 2 to 3 month period. This test can be done anytime of day and does not require fasting. The Fasting Plasma Glucose Test (FPG) measures a person’s blood glucose after an overnight fast (8 to 12 hours). The 2-Hour Glucose Challenge is performed after an overnight 8 to 12 hour fast and measures a person’s plasma 2 hours after drinking a 75-gram glucose solution. †† A1C testing for diagnostic purposes should be performed in a laboratory using a method that is NGSP certified. Point of care A1C tests should not be used for diagnosis. With the use of the A1c for diabetes diagnosis, those interpreting these results need to be alert to the impact of hemoglobin variants on A1C values. See www2.niddk.nih.gov/variants for more information. Reference American Diabetes Association. Standards of Medical Care in Diabetes. Diabetes Care 2010; 33 (Suppl. 1):S11-61. American Diabetes Association. Diabetes Care 2010; 33;(Suppl.1):S11-61. .
 measures a person’s blood glucose after an overnight fast (8 to 12 hours). The 2-Hour Glucose Challenge is performed after an overnight 8 to 12 hour fast and measures a person’s plasma 2 hours after drinking a 75-gram glucose solution. †† A1C testing for diagnostic purposes should be performed in a laboratory using a method that is NGSP certified. Point of care A1C tests should not be used for diagnosis. With the use of the A1c for diabetes diagnosis, those interpreting these results need to be alert to the impact of hemoglobin variants on A1C values. See www2.niddk.nih.gov/variants for more information. Reference. American Diabetes Association. Standards of Medical Care in Diabetes. Diabetes Care 2010; 33 (Suppl. 1):S American Diabetes Association. Diabetes Care 2010; 33;(Suppl.1):S")
37
Diabetes Prevention Program (DPP)
O DPP foi o maior trial clinico desenhado para determinar a combinacao dieta e exercicio ou o hipoglicemiante oral Metformina poderiam prevenir ou retardar o desenvolvimento de DM2 The Diabetes Prevention Program (DPP) was a major clinical trial ( ) sponsored by the National Institutes of Health to determine whether diet and exercise or the oral diabetes drug metformin could prevent or delay the onset of type 2 diabetes. Reference Diabetes Prevention Program Research Group. Reduction in the incidence of type 2 diabetes with lifestyle intervention or metformin. N Engl J Med 2002, Vol.346, No. 6. DPP Research Group. N Engl J Med 2002, Vol.346, No. 6.
 was a major clinical trial ( ) sponsored by the National Institutes of Health to determine whether diet and exercise or the oral diabetes drug metformin could prevent or delay the onset of type 2 diabetes. Reference. Diabetes Prevention Program Research Group. Reduction in the incidence of type 2 diabetes with lifestyle intervention or metformin. N Engl J Med 2002, Vol.346, No. 6. DPP Research Group. N Engl J Med 2002, Vol.346, No. 6.")
38
DPP - Metodos MEV Metformin Placebo Reducao de peso: 5% - 7%
Dieta hipocalorica e hipogordurosa 30 minutos de atividade fisica, 5x semana Metformin Placebo Diabetes Prevention Program (DPP) participants were randomly assigned to one of three interventions: 1. The intensive lifestyle modification program, where participants were encouraged to lose 5% to 7% of their bodyweight by following a healthy low-calorie, low-fat diet and by getting 30 minutes of physical activity, 5 days a week. 2. Standard lifestyle recommendations plus metformin, an oral diabetes drug. 3. Standard lifestyle recommendations plus placebo twice daily. Reference Diabetes Prevention Program Research Group. Reduction in the incidence of type 2 diabetes with lifestyle intervention or metformin. N Engl J Med 2002, Vol.346, No. 6. DPP Research Group. N Engl J Med 2002, Vol.346, No. 6.
 participants were randomly assigned to one of three interventions: 1. The intensive lifestyle modification program, where participants were encouraged to lose 5% to 7% of their bodyweight by following a healthy low-calorie, low-fat diet and by getting 30 minutes of physical activity, 5 days a week. 2. Standard lifestyle recommendations plus metformin, an oral diabetes drug. 3. Standard lifestyle recommendations plus placebo twice daily. Reference. Diabetes Prevention Program Research Group. Reduction in the incidence of type 2 diabetes with lifestyle intervention or metformin. N Engl J Med 2002, Vol.346, No. 6. DPP Research Group. N Engl J Med 2002, Vol.346, No. 6.")
39
The clinical trial ended one year earlier than planned because the results were so clear:
The lifestyle intervention group reduced their risk of developing diabetes by 58 percent. This powerful reduction in risk of diabetes was found in all subgroups, including men and women, the ethnic groups that made up 45 percent of participants, women with a history of gestational diabetes, and people age 60 and older. In fact, lifestyle changes worked particularly well for participants aged 60 and older reduced their risk of developing diabetes by 71 percent. Participants who took metformin reduced their risk of developing diabetes by 31 percent. Metformin was effective for both men and women, and was more effective in younger, heavier people—those 25 to 40 years old with a BMI of 36 (about 50 to 80 pounds overweight). This study demonstrated that type 2 diabetes can be prevented or delayed. Reference Diabetes Prevention Program Research Group. Reduction in the incidence of type 2 diabetes with lifestyle intervention or metformin. N Engl J Med 2002, Vol.346, No. 6.
. This study demonstrated that type 2 diabetes can be prevented or delayed. Reference. Diabetes Prevention Program Research Group. Reduction in the incidence of type 2 diabetes with lifestyle intervention or metformin. N Engl J Med 2002, Vol.346, No. 6.")
40
Diabetes Prevention Program Outcomes Study (DPPOS)
Seguimento de 10 anos, MEV: Reduziu a taxa de desenvolvimento de DM2 em 34 % Retardou o desnvolvimento de DM2 em 4 anos Reduziu fatores de risco cardiovasculares. Reduziu A1C e glicemia de jejum After an average of 10 years’ follow up, intensive lifestyle changes aimed at modest weight loss: reduced the rate of developing type 2 diabetes by 34 percent compared with placebo. reduced the rate of developing type 2 diabetes by 49 percent in those age 60 and older compared with placebo. delayed type 2 diabetes by about 4 years compared with placebo. reduced cardiovascular risk factors. reduced hemoglobin A1c (A1C) and fasting glucose compared with placebo. The A1C test gives information about average blood glucose levels for the past 2 to 3 months. Reference: Diabetes Prevention Program Research Group (2009). “10-year follow-up of diabetes incidence and weight loss in the Diabetes Prevention Program Outcomes Study” available at DPP Research Group. The Lancet 2009: Vol.374, No
 and fasting glucose compared with placebo. The A1C test gives information about average blood glucose levels for the past 2 to 3 months. Reference: Diabetes Prevention Program Research Group (2009). 10-year follow-up of diabetes incidence and weight loss in the Diabetes Prevention Program Outcomes Study available at DPP Research Group. The Lancet 2009: Vol.374, No")
41
Diabetes Prevention Program Outcomes Study (DPPOS)
Seguimento de 10 anos, Metformina Reduziu a taxa de desenvolvimento de DM2 em 18 % comparado com placebo Retardou o desnvolvimento de DM2 em 2 anos comparado com o placebo. Reduziu A1C e glicemia de jejum comparado como o placebo. After an average of 10 years’ follow up, treatment with metformin reduced the rate of developing diabetes by 18 percent compared with placebo. delayed diabetes by 2 years compared with placebo. reduced A1C and fasting glucose compared with placebo. Results from Diabetes Prevention Program Outcomes Study (DPPOS), the 10 year follow-up study to the DPP, reinforced the earlier findings that type 2 diabetes can be prevented or delayed. Reference: Diabetes Prevention Program Research Group (2009). “10-year follow-up of diabetes incidence and weight loss in the Diabetes Prevention Program Outcomes Study” available at DPP Research Group. The Lancet 2009: Vol.374, No
, the 10 year follow-up study to the DPP, reinforced the earlier findings that type 2 diabetes can be prevented or delayed. Reference: Diabetes Prevention Program Research Group (2009). 10-year follow-up of diabetes incidence and weight loss in the Diabetes Prevention Program Outcomes Study available at DPP Research Group. The Lancet 2009: Vol.374, No")
42
Risco Cardiovascular Modificavel
Sindrome Metabolica Dislipidemia Diabetes/Pre-Diabetes Hipertensao Arterial

43
Dados Mundiais: Mortes em 2000 atribuíveis a fatores de risco selecionados
Hipertensão 1.000 2.000 3.000 4.000 5.000 6.000 7.000 8.000 Número de mortes (000s) Baixo Peso Tabagismo Colesterol elevado Sexo não-seguro Baixo consumo de vegetais Obesidade Sedentarismo Alcoolismo Água imprópria Fumaça de combustível sólido Deficiência de ferro Poluição urbana do ar Deficiência de zinco Deficiência de vitamina A Injeções não-seguras no cuidado à saúde Fatores de risco ocupacionais Fonte: Portal da Hipertensão WHR 2002
 Baixo Peso. Tabagismo. Colesterol elevado. Sexo não-seguro. Baixo consumo de vegetais. Obesidade. Sedentarismo. Alcoolismo. Água imprópria. Fumaça de combustível sólido. Deficiência de ferro. Poluição urbana do ar. Deficiência de zinco. Deficiência de vitamina A. Injeções não-seguras no cuidado à saúde. Fatores de risco ocupacionais. Fonte: Portal da Hipertensão. WHR")
44
Prevalência de Hipertensão Arterial
Estudos populacionais para PA >140/90 mmHg Araraquara 1990 S.Paulo Piracicaba 1991 P.Alegre 1994 Cotia 1997 Catanduva 2001 43 22 33 26 44 32 20 40 60 80 100 37 Goiânia * 2002 % IV Diretrizes Brasileiras de Hipertensão 2002 * Hipertensão, vol6.(Supl) .2003 Fonte: Portal da Hipertensão
 Fonte: Portal da Hipertensão.")
45
HIPERTENSÃO ARTERIAL PREVALÊNCIA 66 64 54 44 21 11 4 S A H %
Faixas Etárias 18-29 30-39 40-49 50-59 +80 60-69 70-79 20 10 30 40 50 60 70 4 11 21 44 54 64 66

46
População Porto Alegre / Brasileira com idade 20 anos: 94.352.676*
PA 140/90 mm Hg ou AH (35%) Sabem (56%) Não sabem (44%) Não tratam (12%) Tratam (44%) PA 140/90 (28%) PA <140/90 (16%) Fonte: Portal da Hipertensão Fuchs FD et al. Resumo CSBC , Arquivos Brasileiro de Cardiologia, 2001
 Sabem (56%) Não sabem (44%) Não tratam (12%) Tratam (44%) PA 140/ (28%) PA <140/ (16%) Fonte: Portal da Hipertensão. Fuchs FD et al. Resumo CSBC , Arquivos Brasileiro de Cardiologia,")
47
HIPERTENSÃO ARTERIAL DIAGNÓSTICO
Realizar a medida da pressão arterial em toda avaliação clínica. Utilizar aparelhos calibrados e técnica adequada. Realizar no mínimo duas medidas com intervalos de 2’ entre elas. Na 1ª avaliação verificar nos dois membros superiores. Nos idosos, diabéticos e pacientes em uso de medicação anti-hipertensiva verificar a PA também na posição ortostática.

48
Classificação da PA (> 18 anos)
IV Diretrizes Brasileiras de Hipertensão Arterial (SBC / SBN / SBH) Classificação PAS (mmHg) PAD (mmHg) Ótima < 120 < 80 Normal < 130 < 85 Limítrofe 85-89 Hipertensão Estágio I (leve) 90-99 Estágio II (moderado) Estágio III (grave) 180 110 Sistólica isolada 140 > 90 O valor mais alto de sistólica ou diastólica estabelece o estágio do quadro hipertensivo. Quando as pressões sistólica e diastólica situam-se em categorias diferentes, a maior deve ser utilizada para classificação do estágio. Fonte: Portal da Hipertensão IV Diretrizes Brasileiras de Hipertensão Arterial, 2002
 Classificação. PAS (mmHg) PAD (mmHg) Ótima. < 120. < 80. Normal. < 130. < 85. Limítrofe Hipertensão. Estágio I (leve) Estágio II (moderado) Estágio III (grave) 180. 110. Sistólica isolada. 140. > 90. O valor mais alto de sistólica ou diastólica estabelece o estágio do quadro hipertensivo. Quando as pressões sistólica e diastólica situam-se em categorias diferentes, a maior deve ser utilizada para classificação do estágio. Fonte: Portal da Hipertensão. IV Diretrizes Brasileiras de Hipertensão Arterial,")
49
Decisão terapêutica, segundo risco e pressão arterial
B C Normal / limítrofe ( / 85-89) MEV MEV MEV* Estágio 1 ( / 90-99) MEV (até 12 meses) MEV** (até 6 meses) TM Estágio 2 e 3 ( 160 / 100) TM TM TM MEV: Mudança de estilo de vida; TM: tratamento medicamentoso *TM se insuficiência cardíaca, renal crônica ou diabete ** TM se múltiplos fatores de risco - Pesquisar sobre fatores de risco: Dislipidemia, Tabagismo, DM, Sedentarismo, Hereditariedade Fonte: Portal da Hipertensão IV Diretrizes Brasileiras de Hipertensão Arterial
 MEV. MEV. MEV* Estágio 1. ( / 90-99) MEV. (até 12 meses) MEV** (até 6 meses) TM. Estágio 2 e 3. ( 160 / 100) TM. TM. TM. MEV: Mudança de estilo de vida; TM: tratamento medicamentoso. *TM se insuficiência cardíaca, renal crônica ou diabete. ** TM se múltiplos fatores de risco - Pesquisar sobre fatores de risco: Dislipidemia, Tabagismo, DM, Sedentarismo, Hereditariedade. Fonte: Portal da Hipertensão. IV Diretrizes Brasileiras de Hipertensão Arterial")
50
Hipertensão Arterial Risco da Pressão Normal - Alta
10 8 6 4 2 Women High normal Cumulative Incidence (%) Normal Optimal Time (yr) No. At Risk Optimal Normal High normal Fonte: Portal da Hipertensão Vasan RS et al: N Engl J Med 2001;345:1291-7 7º JNC. Hypertension. 2003; 42:
 Normal. Optimal Time (yr) No. At Risk. Optimal Normal High normal Fonte: Portal da Hipertensão. Vasan RS et al: N Engl J Med 2001;345: º JNC. Hypertension. 2003; 42:")
51
Hipertensão Arterial Risco da Pressão Normal- Alta
10 8 6 4 2 Men High normal Normal Cumulative Incidence (%) Optimal Time (yr) No. At Risk Optimal Normal High normal Fonte: Portal da Hipertensão Vasan RS et al: N Engl J Med 2001;345:1291-7 7º JNC. Hypertension. 2003; 42:
 Optimal Time (yr) No. At Risk. Optimal Normal High normal Fonte: Portal da Hipertensão. Vasan RS et al: N Engl J Med 2001;345: º JNC. Hypertension. 2003; 42:")
52
Sistólica Diastólica Categoria < 120 120 - 129 130 - 139 140 - 159
Classificação dos níveis de pressão arterial European Society of Hypertension–European Society of Cardiology Guidelines for the management of arterial hypertension Categoria Ótima Normal Normal alta Hipertensão Grau 1 (suave) Hipertensão Grau 2 (moderada) Hipertensão Grau 3 (severa) Hipertensão sistólica isolada Sistólica < 120 180 140 Diastólica < 80 110 < 90 ESH, Journal of Hypertension 2003, 21:1011–1053 Fonte: Portal da Hipertensão
 Hipertensão Grau 2 (moderada) Hipertensão Grau 3 (severa) Hipertensão sistólica isolada. Sistólica. < 180. 140. Diastólica. < 110. < 90. ESH, Journal of Hypertension 2003, 21:1011–1053. Fonte: Portal da Hipertensão.")
53
Classificação PA Normal Pré hipertensão Hipertensão Estágio 1
Classificação da Pressão Arterial - Adultos SEVENTH REPORT OF THE JOINT NATIONAL COMMITTEE ON PREVENTION, DETECTION, EVALUATION, AND TREATMENT OF HIGH BLOOD PRESSURE Classificação PA Normal Pré hipertensão Hipertensão Estágio 1 Hipertensão Estágio 2 PAS mm Hg < 120 160 PAD mm Hg e < 80 ou ou ou 100 Fonte: Portal da Hipertensão 7º JNC. Hypertension. 2003; 42:

54
Estratificação do Risco individual do paciente hipertenso
Pressão Arterial Normal Alta HT Estágio I HT Estágio II HT Estágio III FR Sem Risco Adicional Risco Baixo Adicional Risco Médio Adicional Risco Alto Adicional Sem Fator de Risco Risco Baixo Adicional Risco Médio Adicional Risco Médio Adicional Risco Muito Alto Adicional 1 a 2 Fatores de Risco > 2 FR ou Lesão de Órgão Alvo Risco Alto Adicional Risco Alto Adicional Risco Alto Adicional Risco Muito Alto Adicional Risco Muito Alto Adicional Risco Muito Alto Adicional Risco Muito Alto Adicional Risco Muito Alto Adicional Doença Cardiovascular Fonte: Portal da Hipertensão Guideline ESH/ESC

55
Distribuições dos valores da PAS
A Importância de Pequenas Diferenças de Pressão Arterial Distribuições dos valores da PAS Pós intervenção Pré intervenção Redução na PA Redução da PAS mmHg % Redução de mortalidade AVC DAC Total 2 3 5 - 8 - 14 - 4 - 5 - 9 - 3 - 4 - 7 Fonte: Portal da Hipertensão Whelton PK et al. JAMA 2002:288:1884. 7º JNC. Hypertension. 2003; 42:

56
OBRIGADO

Apresentações semelhantes


 – Lápides 1, 2, 3» «nomes gravados, 21 de Agosto de 2008» «Ultramar.TerraWeb»>")


