Carregar apresentação
A apresentação está carregando. Por favor, espere

1
Situação Epidemiológica Atual da Hanseníase Estado de São Paulo
Situação Epidemiológica Atual da Hanseníase Estado de São Paulo. Programa Estadual de Controle da Hanseníase Divisão Técnica de Vigilância Epidemiológica em Hanseníase do CVE REUNIÃO DE AVALIAÇÃO DAS AÇÕES DE CONTROLE DA HANSENÍASE 13-14 DE MAIO DE 2015 MARY LISE CARVALHO MARZLIAK

3
Plano Estratégico para a Eliminação da Hanseníase 2000-2005
Compromisso de eliminar a hanseníase como um problema de saúde pública até o ano 2000 ª Conferência Mundial de Saúde Menos de 1 doente a cada habitantes (122 países) Prazo para o cumprimento da meta foi postergado para 2005. Em 2011 Brasil, Timor Leste
 Prazo para o cumprimento da meta foi postergado para Em 2011 Brasil, Timor Leste.")
4
Prevalência Registrada no início do ano (p/10.000)
Prevalencia Global Região OMS Prevalência Registrada no início do ano (p/10.000) 2004 2005 2006 2007 2008 2009 2010 2011 2012 2013 África (0.81) 47.596 (0.66) 40.830 (0,56) 29.548 (0,55) 30.055 (0,47) 30.557 (0,45) 30.947 (0,40) 27.111 (0,38) 15.006 (0,37) 17.540 (0,26) Américas 83.233 (0.99) 36.877 (0.42) 32.904 (0,39) 64.715 (0,76) 49.388 (0,96) 47.069 (0,54) 43.370 (0,49) 33.953 34.801 33.926 Medit. Leste 5.780 (0.11) 5.398 (0.12) 4.024 (0,09) 3.986 4.240 4.967 (0,10) 8.495 (0,15) 9.046 (0,17) 7.368 (0,12) 4.960 (0,08) Sudeste Ásia (1.90) (1.14) (0,81) (0,70) (0.72) (0,69) (0,68) (0,64) Pacífico Oeste 10.449 (0.06) 10.010 8.646 (0,05) 9.805 (0,06) 8.152 9.754 8.635 8.386 7.619 7.425 Total (0,34) (0,33) Weekly epidemiological record.2 september 2011, 86th year. No. 36, 2011, 86, 389–400
 África (0.81) (0.66) (0,56) (0,55) (0,47) (0,45) (0,40) (0,38) (0,37) (0,26) Américas (0.99) (0.42) (0,39) (0,76) (0,96) (0,54) (0,49) Medit. Leste (0.11) (0.12) (0,09) (0,10) (0,15) (0,17) (0,12) (0,08) Sudeste. Ásia (1.90) (1.14) (0,81) (0,70) (0.72) (0,69) (0,68) (0,64) Pacífico. Oeste (0.06) (0,05) (0,06) Total (0,34) (0,33) Weekly epidemiological record.2 september 2011, 86th year. No. 36, 2011, 86, 389–")
5
Mudança no Cálculo da Prevalência
79.908 4,6 p/ hab. 30.693 1,71 p/ hab. Em curso de Tratamento PB – 6 doses em até 9 meses Mb – 12 doses em até 18 meses 27.313 1,48 p/ hab.

6
Situação da Hanseníase em países que ainda não haviam atingido a meta ( jan 2005).
Prevalência Registrada No início de 2004 No início de 2005 Angola 3.776(2.8) Brasil 79.908(4.6) Rep.CentroAfricana 952(2.6) Rep.Dem.Congo 6.891(1.3) Índia (2.6) Madagascar 5.514(3.4) Moçambique 6.810(3.4) Nepal 7.549(3.1) Rep.Unida Tanzânia 5.420(1.6) Total 2.496 (1.60) (1.70) 4389(1.10) (1.90) (1.40) 4.6109(2.50) 4.6929(2.40) 4.6999(1.80) 4.7779(1.30)
 Brasil (4.6) Rep.CentroAfricana. 952(2.6) Rep.Dem.Congo (1.3) Índia (2.6) Madagascar (3.4) Moçambique (3.4) Nepal (3.1) Rep.Unida Tanzânia (1.6) Total (1.60) (1.70) 4389(1.10) (1.90) (1.40) (2.50) (2.40) (1.80) (1.30)")
7
Detecção de Casos Novos
Tendência de Detecção de Casos Novos, OMS, Região OMS Detecção de Casos Novos 2004 2005 2006 2007 2008 2009 2010 2011 2012 2013 África 46.918 45.179 34.480 34.468 29.814 (4,37) 28.935 25.345 ( 3,53) 12.637 (3,14) 20.599 (3,05) 20.911 (3,50) Américas 52.662 41.952 47.612 42.135 41.891 (4,85) 40.474 37.740 (4,25) 36.832 (4,18) 36.178 (4,14) 33.084 (3,78) Medit. Leste 3.392 3.133 3.261 4.091 3.938 (0,80) 4.029 4.080 (0,67) 4.346 (0,72) 4.235 1.680 (0,35) Sudeste Ásia (9,60) (8,77) 8,75 (8.89) (8,38) Pacífico Oeste 6.216 7.137 6.190 5.863 5.859 (0,33) 5.243 5.055 (0,28) 5.092 (0,30) 5.040 (0,40) 4.596 (0,25) Total (3,93) (4,006) (4,00) (3,81) Fonte de dados de 115 paíse e territórios, excluindo Europa.
 ( 3,53) (3,14) (3,05) (3,50) Américas (4,85) (4,25) (4,18) (4,14) (3,78) Medit. Leste (0,80) (0,67) (0,72) (0,35) Sudeste. Ásia (9,60) (8,77) , (8.89) (8,38) Pacífico. Oeste (0,33) (0,28) (0,30) (0,40) (0,25) Total (3,93) (4,006) (4,00) (3,81) Fonte de dados de 115 paíse e territórios, excluindo Europa.")
8
Nº de Casos Novos Detectados
1993 2002 2003 2004 2005 2006 2007 2008 2009 2010 2011 2012 2013 Angola 339 4.272 2.933 2.109 1.877 1.078 1.269 1.184 937 1.076 Bangladesh 6.943 9.844 8.712 8.242 7.882 6.280 5.367 5.249 5.239 3.848 3.970 3.688 3.141 Brasil 34.235 38.365 49.206 49.384 38.410 44.436 39.921 38.914 37.610 34.894 33.955 33.303 31.044 China 3.55 1.646 1.404 1.499 1.658 1.06 1.526 1.614 1.597 1.324 Côte d’Ivoire 976 1.204 998 884 NR 770 1.030 1.169 Rep.Dem.Congo 3.927 5.037 7.165 1.1781 10.369 8.257 8.820 6.114 5.062 5.049 3.949 3.607 3.744 India Indonésia 12638 12377 14641 16549 19695 17682 17723 17.441 17.260 17.012 20.023 18.994 16.856 Madagascar 740 5.482 5.104 3.710 2.709 1.536 1.644 1.763 1.572 1.520 1.577 1.474 1.569 Moçambique 1.930 5.830 5.907 4.266 5.371 3.637 2.510 1.313 1.191 1.207 1.097 Miamar 12.018 7.386 3.808 3.748 3.571 3.721 3.365 3.147 2.936 3.082 3.013 2.950 Nepal 6.152 13.830 8.046 6.958 6.150 4.235 4.436 4.708 4.394* 3.118* 3.184 3.492 3.255 Nigeria 4.381 5.078 4.799 5.276 5.024 3.544 4.665 4.899 4.219 3.913 NA 3.805 3.385 Filipinas 3.442 2.479 2.397 2.254 3.130 2.517 2.514 2.373 1.795 2.041 1.818 2.150 1.729 Sudão do Sul 1.799 Sri Lanka 944 2.214 1.925 1.995 1.924 1.993 2.024 1.979 1.875 2.077 2.178 2.191 1.990 Sudão 722 720 1.706 1.901 2.100 2.394 706 Rep.Unida da Tanzânia 2.731 6.497 5.279 5.190 4.237 3.450 3.276 2.654 2.349 2.528 2.005 Total (96%) (93%) (94%) (94%) (93%) (95%) (94%) (93%) Total Mundial Timor-Leste 83 Detecção de casos novos em 18 países que registraram ou mais casos novos
 (93%) (94%) (94%) (93%) (95%) (94%) (93%) Total Mundial Timor-Leste. 83. Detecção de casos novos em 18 países que registraram ou mais casos novos")
9
Brasil

10
Metas Pactuadas pelo PNCH para 2008 a 2011
Pacto pela Saúde Portaria nº399/GM – 22/02/2006 Pacto pela Vida Pacto em Defesa do SUS Pacto de Gestão PPI-VS PAP-VS – Programa de Ações Prioritárias – Vigilância em Saúde Portaria 91/GM de 10/01/2007 PPI Assistencial Programação Pactuada e Integrada da Assitência à Saúde Portaria 1097 de 22 de maio de 2006 Meta Programa Reduzir em 10% o coeficiente de detecção de casos novos de hanseníase em menores de 15 anos, no país, até 2011. PAC – MAIS SAÚDE Aumentar de 38% para 50% a cobertura de UBS com o programa implantado em 2008 PPA Curar 85%em 2008,87% em 2010 e 90% dos casos de hanseníase diagnosticados nos anos das coortes (MB e PB) em 2011 PPA &PACTO DE GESTÃO Examinar pelo menos 50% dos contatos domiciliares dos casos novos diagnosticados em 2008 PAVS Avaliar o grau de incapacidade em 75% dos casos novos no diagnóstico Avaliar o grau de Incapacidade em 50% dos casos novos na cura
 em PPA &PACTO DE GESTÃO. Examinar pelo menos 50% dos contatos domiciliares dos casos novos diagnosticados em PAVS. Avaliar o grau de incapacidade em 75% dos casos novos no diagnóstico. Avaliar o grau de Incapacidade em 50% dos casos novos na cura.")
12
Apesar de estudos de tendência mostrarem que a endemia hansênica está em decréscimo, o geoprocessamento de casos novos mostra que existem focos de transmissão recente particularmente nos nove estados da Amazônia legal.

13
Agregação de casos novos de hanseníase, pelo coeficiente de detecção no Brasil, 2005 a 2007
Cluster analysis of the overall detection rate of leprosy in Brazil for the triennium Estabilização dos coeficientes de detecção São municípios incluídos nos 10 clusters. Hanseníase apresenta tendência de estabilização dos coeficientes de detecção no Brasil, mas ainda em patamares muito altos nas regiões Norte, Centro-Oeste e Nordeste. Essas regiões concentram 53,5% dos casos detectados em apenas 17,5% da população brasileira. Os 621 municípios incluídos nos 10 clusters estão localizados principalmente nos estados de Mato Grosso, Pará, Maranhão, Tocantins, Goiás, Rondônia e Bahia. Eles representam 44% dos casos novos diagnosticados em e 14% da população brasileira. Fonte:MS/SVS/CGHDE-Sinan

14
Estratégia Global para a Redução de Morbidade por Hanseníase OMS - Nova Déli, Índia. 1. Redução do coeficiente de casos novos diagnosticados com incapacidades grau II para cada habitantes em pelo menos 35% até o fim de 2015 em comparação com a linha de base do início de 2011. 2. Exame de todos os Contatos intradomiciliares dos casos de hanseníase recem-detectados. “Seu Julico e o tempo de esperança”

15
PLANO INTEGRADO DE AÇÕES ESTRATÉGICAS DE ELIMINAÇÃO DA HANSENÍASE, FILARIOSE, ESQUISTOSSOMOSE E ONCOCERCOSE COMO PROBLEMA DE SAÚDE PÚBLICA, TRACOMA COMO CAUSA DE CEGUEIRA E CONTROLE DAS GEOHELMINTÍASES Plano de Ação 2011 a 2015 Doenças negligenciadas que tendem a coexistir em áreas em que a população apresenta precárias condições de vida Brasil sem Miséria. 253 municípios prioritários incluindo as 27 capitais. Hanseníase Alcançar prevalência de menos de um caso para habitantes. Alcançar e manter o percentual de 90% de cura nas coortes de casos novos de hanseníase até 2015. Aumentar a cobertura de exames de contatos intradomiciliares para ≥ 80% dos casos novos de hanseníase até 2015. Reduzir em 26,9% o coeficiente de detecção de casos novos de hanseníase em menores de 15 anos até 2015.

16
Plano Integrado em São Paulo
Portaria GM 2556, que foi publicada em 31/10/2011 no D.O.U trata dos mecanismos de repasse financeiro do Fundo Nacional de Saúde aos Fundos Estaduais e Municipais para fortalecimento dos programas de hanseníase e outras doenças. 4 Municípios Prioritários: Capital, Piedade, Francisco Morato e Rubinéia Busca Ativa em crianças de 5 a 14 anos da rede pública de ensino Hanseníase: busca ativa Geohelmintíase: tratamento massivo com 400mg de Albendazol Tracoma: Exame oftalmológico e tratamento do caso e familiares Município de São Paulo – ,00 Francisco Morato SP ,00 Piedade SP ,00 Rubinéia SP 4.000,00

17
44ª Conferência Mundial até 2000 Plano Integrado de Ações Estratégicas
121 países e o Brasil Plano Estratégico para a Eliminação da Hanseníase 2000 a 2005 Mudança de Cálculo do Indicador Estratégia Global para Redução da Carga de Hanseníase 2006 a 2010 Clusters e Municípios Prioritários Indicadores pactuados Detecção Geral e em Menores de 15 Exame de Contatos Alta por Cura Avaliação de Incapacidades e Coeficiente Grau II Estratégia Global Aprimorada 2010 a 2015 Plano Integrado de Ações Estratégicas Hanseíase, Geohelmintíase e Tracoma Esquistossomose Qualidade da Assistencia com Visão Holística das pessoas afetadas. Eliminação SmartArt custom animation effects: vertical box list (Intermediate) To reproduce the SmartArt effects on this slide, do the following: Press and hold CTRL, and then select the third pair of rectangles from the top (both the smaller, first-level rectangle and the larger, second-level rectangle). Under SmartArt Tools, on the Design tab, in the Create Graphic group, click the arrow next to Add Shape, and then click Add Shape After. On the Insert tab, in the Illustrations group, click SmartArt. In the Choose a SmartArt Graphic dialog box, in the left pane, click List. In the List pane, click Vertical Box List (first row, fourth option from the left), and then click OK to insert the graphic into the slide. On the Home tab, in the Slides group, click Layout, and then click Blank. Select the graphic, and then click one of the arrows on the left border. In the Type your text here dialog box, enter text. (Note: To create a bullet below each heading, select the heading text box in the Type your text here dialog box, and then under SmartArt Tools, on the Design tab, in the Create Graphic group, click Add Bullet. Enter text into the new bullet text box.) Select the graphic. Under SmartArt Tools, on the Format tab, click Size, and then do the following: In the Width box, enter 6.67”. In the Height box, enter 5.92”. Under SmartArt Tools, on the Format tab, click Arrange, click Align, and then do the following: Click Align to Slide. On the Design tab, in the Themes group, click Colors, and then under Built-in click Civic. (Note: if this action is taken in a PowerPoint presentation containing more than one slide, the color scheme will be applied to all of the slides.) Click Align Center. Click Align Middle. Under SmartArt Tools, on the Design tab, in the SmartArt Styles group, do the following: Click More, and then under 3-D click Polished (first row, first option from the left). Click Change Colors, and then under Accent 1 click Colored Fill – Accent 1 (second option from the left). Press and hold CTRL, and then select the four larger, second-level rectangles. Under SmartArt Tools, on the Format tab, in the Shapes group, click Change Shape, and then under Rectangles click Rounded Rectangle (second option from the left). Under SmartArt Tools, on the Format tab, in the Shape Styles group, click the arrow next to Shape Fill, point to Gradient, and then click More Gradients. In the Format Shape dialog box, in the left pane, click Fill, select Gradient fill in the Fill pane, and then do the following: On the Home tab, in the Font group, select Franklin Gothic Book from the Font list, and then select 24 from the Font Size list. Click the button next to Direction, and then click Linear Up (second row, second option from the left). In the Type list, select Linear. Also under Gradient stops, customize the gradient stops as follows: Under Gradient stops, click Add or Remove until two stops appear in the drop-down list. Select Stop 1 from the list, and then do the following: In the Stop position box, enter 0%. Select Stop 2 from the list, and then do the following: Click the button next to Color, and then under Theme Colors click White, Background 1, Darker 35% (fifth row, first option from the left). Click the button next to Color, and then click Black, Text 1, Lighter 25% (fourth row, second option from the left). In the Stop position box, enter 100%. Also in the Format Shape dialog box, in the left pane, click 3-D Format, and then do the following in the 3-D Format pane: Under Depth, in the Depth box, enter 1 pt. Under Bevel, click the button next to Top, and then under Bevel click Circle (first row, first option from the left). Next to Top, in the Width box, enter 4 pt, and in the Height box, enter 4 pt. Select the top first-level rectangle. Under SmartArt Tools, on the Format tab, in the Shape Styles group, click the arrow next to Shape Fill, point to Gradient, and then click More Gradients. In the Format Shape dialog box, in the left pane, click Fill, select Gradient fill in the Fill pane, and then do the following: On the slide, press and hold CTRL, and then select the four smaller, first-level rectangles. On the Home tab, in the Font group, select Franklin Gothic Medium from the Font list, and then enter 26 in the Font Size box. Under Surface, click the button next to Material, and then under Standard click Plastic (third option from the left). Click the button next to Lighting, and then under Special click Flat (first option from the left). Click the button next to Color, and then under Theme Colors click Teal, Accent 3, Darker 50% (sixth row, seventh option from the left). Select the second first-level rectangle. Under SmartArt Tools, on the Format tab, in the Shape Styles group, click the arrow next to Shape Fill, point to Gradient, and then click More Gradients. In the Format Shape dialog box, in the left pane, click Fill, select Gradient fill in the Fill pane, and then do the following: Click the button next to Color, and then under Theme Colors click Teal, Accent 3, Darker 25% (fifth row, seventh option from the left). Click the button next to Color, and then under Theme Colors click Brown, Accent 4, Darker 50% (sixth row, eighth option from the left). Select the third first-level rectangle. Under SmartArt Tools, on the Format tab, in the Shape Styles group, click the arrow next to Shape Fill, point to Gradient, and then click More Gradients. In the Format Shape dialog box, in the left pane, click Fill, select Gradient fill in the Fill pane, and then do the following: Click the button next to Color, and then under Theme Colors click Brown, Accent 4, Darker 25% (fifth row, eighth option from the left). Click the button next to Color, and then under Theme Colors click Green, Accent 5, Darker 50% (sixth row, ninth option from the left). Select the fourth first-level rectangle. Under SmartArt Tools, on the Format tab, in the Shape Styles group, click the arrow next to Shape Fill, point to Gradient, and then click More Gradients. In the Format Shape dialog box, in the left pane, click Fill, select Gradient fill in the Fill pane, and then do the following: Click the button next to Color, and then under Theme Colors click Green, Accent 5, Darker 25% (fifth row, ninth option from the left). Click the button next to Color, and then under Theme Colors click Orange, Accent 6, Darker 50% (sixth row, 10th option from the left). Click the button next to Color, and then under Theme Colors click Orange, Accent 6, Darker 20% (fifth row, 10th option from the left). To reproduce the animation effects on this slide, do the following: On the slide, select the graphic. In the Custom Animation task pane, do the following: On the Animations tab, in the Animations group, click Custom Animation. Click Add Effect, point to Entrance, and then click More Effects. In the Add Entrance Effect dialog box, under Subtle, click Expand. Also in the Custom Animation task pane, click the double arrow under the animation effect to expand the contents of the list of effects, and then do the following: Also in the Custom Animation task pane, select the animation effect. Click the arrow to the right of the animation effect, and then click Effect Options. In the Expand dialog box, on the SmartArt Animation tab, in the Group graphic list, select One by one. Under Modify: Expand, in the Speed list, select Fast. Press and hold CTRL, and then select all of the animation effects. Under Modify: Expand, in the Start list, select With Previous. Press and hold CTRL, and then select the third, fifth, and seventh animation effects. Under Modify: Expand, in the Start list, select On Click. Press and hold CTRL, and then select the second, fourth, sixth and eighth animation effects (expand effects for the larger, second-level rectangles). Click Change, point to Entrance, and then click More Effects. In the Change Entrance Effect dialog box, under Moderate, click Compress. To reproduce the background effects on this slide, do the following: Right-click the slide background area, and then click Format Background. In the Format Background dialog box, click Fill in the left pane, select Gradient fill in the Fill pane, and then do the following: Click the button next to Direction, and then click Linear Down (first row, second option from the left). Also under Gradient stops, customize the gradient stops that you added as follows: Click the button next to Color, and then under Theme Colors click Black, Text 1 (first row, second option from the left). In the Stop position box, enter 63%. Click the button next to Color, and then under Theme Colors click Black, Text 1, Lighter 50% (second row, second option from the left).
 To reproduce the SmartArt effects on this slide, do the following: Press and hold CTRL, and then select the third pair of rectangles from the top (both the smaller, first-level rectangle and the larger, second-level rectangle). Under SmartArt Tools, on the Design tab, in the Create Graphic group, click the arrow next to Add Shape, and then click Add Shape After. On the Insert tab, in the Illustrations group, click SmartArt. In the Choose a SmartArt Graphic dialog box, in the left pane, click List. In the List pane, click Vertical Box List (first row, fourth option from the left), and then click OK to insert the graphic into the slide. On the Home tab, in the Slides group, click Layout, and then click Blank. Select the graphic, and then click one of the arrows on the left border. In the Type your text here dialog box, enter text. (Note: To create a bullet below each heading, select the heading text box in the Type your text here dialog box, and then under SmartArt Tools, on the Design tab, in the Create Graphic group, click Add Bullet. Enter text into the new bullet text box.) Select the graphic. Under SmartArt Tools, on the Format tab, click Size, and then do the following: In the Width box, enter In the Height box, enter Under SmartArt Tools, on the Format tab, click Arrange, click Align, and then do the following: Click Align to Slide. On the Design tab, in the Themes group, click Colors, and then under Built-in click Civic. (Note: if this action is taken in a PowerPoint presentation containing more than one slide, the color scheme will be applied to all of the slides.) Click Align Center. Click Align Middle. Under SmartArt Tools, on the Design tab, in the SmartArt Styles group, do the following: Click More, and then under 3-D click Polished (first row, first option from the left). Click Change Colors, and then under Accent 1 click Colored Fill – Accent 1 (second option from the left). Press and hold CTRL, and then select the four larger, second-level rectangles. Under SmartArt Tools, on the Format tab, in the Shapes group, click Change Shape, and then under Rectangles click Rounded Rectangle (second option from the left). Under SmartArt Tools, on the Format tab, in the Shape Styles group, click the arrow next to Shape Fill, point to Gradient, and then click More Gradients. In the Format Shape dialog box, in the left pane, click Fill, select Gradient fill in the Fill pane, and then do the following: On the Home tab, in the Font group, select Franklin Gothic Book from the Font list, and then select 24 from the Font Size list. Click the button next to Direction, and then click Linear Up (second row, second option from the left). In the Type list, select Linear. Also under Gradient stops, customize the gradient stops as follows: Under Gradient stops, click Add or Remove until two stops appear in the drop-down list. Select Stop 1 from the list, and then do the following: In the Stop position box, enter 0%. Select Stop 2 from the list, and then do the following: Click the button next to Color, and then under Theme Colors click White, Background 1, Darker 35% (fifth row, first option from the left). Click the button next to Color, and then click Black, Text 1, Lighter 25% (fourth row, second option from the left). In the Stop position box, enter 100%. Also in the Format Shape dialog box, in the left pane, click 3-D Format, and then do the following in the 3-D Format pane: Under Depth, in the Depth box, enter 1 pt. Under Bevel, click the button next to Top, and then under Bevel click Circle (first row, first option from the left). Next to Top, in the Width box, enter 4 pt, and in the Height box, enter 4 pt. Select the top first-level rectangle. Under SmartArt Tools, on the Format tab, in the Shape Styles group, click the arrow next to Shape Fill, point to Gradient, and then click More Gradients. In the Format Shape dialog box, in the left pane, click Fill, select Gradient fill in the Fill pane, and then do the following: On the slide, press and hold CTRL, and then select the four smaller, first-level rectangles. On the Home tab, in the Font group, select Franklin Gothic Medium from the Font list, and then enter 26 in the Font Size box. Under Surface, click the button next to Material, and then under Standard click Plastic (third option from the left). Click the button next to Lighting, and then under Special click Flat (first option from the left). Click the button next to Color, and then under Theme Colors click Teal, Accent 3, Darker 50% (sixth row, seventh option from the left). Select the second first-level rectangle. Under SmartArt Tools, on the Format tab, in the Shape Styles group, click the arrow next to Shape Fill, point to Gradient, and then click More Gradients. In the Format Shape dialog box, in the left pane, click Fill, select Gradient fill in the Fill pane, and then do the following: Click the button next to Color, and then under Theme Colors click Teal, Accent 3, Darker 25% (fifth row, seventh option from the left). Click the button next to Color, and then under Theme Colors click Brown, Accent 4, Darker 50% (sixth row, eighth option from the left). Select the third first-level rectangle. Under SmartArt Tools, on the Format tab, in the Shape Styles group, click the arrow next to Shape Fill, point to Gradient, and then click More Gradients. In the Format Shape dialog box, in the left pane, click Fill, select Gradient fill in the Fill pane, and then do the following: Click the button next to Color, and then under Theme Colors click Brown, Accent 4, Darker 25% (fifth row, eighth option from the left). Click the button next to Color, and then under Theme Colors click Green, Accent 5, Darker 50% (sixth row, ninth option from the left). Select the fourth first-level rectangle. Under SmartArt Tools, on the Format tab, in the Shape Styles group, click the arrow next to Shape Fill, point to Gradient, and then click More Gradients. In the Format Shape dialog box, in the left pane, click Fill, select Gradient fill in the Fill pane, and then do the following: Click the button next to Color, and then under Theme Colors click Green, Accent 5, Darker 25% (fifth row, ninth option from the left). Click the button next to Color, and then under Theme Colors click Orange, Accent 6, Darker 50% (sixth row, 10th option from the left). Click the button next to Color, and then under Theme Colors click Orange, Accent 6, Darker 20% (fifth row, 10th option from the left). To reproduce the animation effects on this slide, do the following: On the slide, select the graphic. In the Custom Animation task pane, do the following: On the Animations tab, in the Animations group, click Custom Animation. Click Add Effect, point to Entrance, and then click More Effects. In the Add Entrance Effect dialog box, under Subtle, click Expand. Also in the Custom Animation task pane, click the double arrow under the animation effect to expand the contents of the list of effects, and then do the following: Also in the Custom Animation task pane, select the animation effect. Click the arrow to the right of the animation effect, and then click Effect Options. In the Expand dialog box, on the SmartArt Animation tab, in the Group graphic list, select One by one. Under Modify: Expand, in the Speed list, select Fast. Press and hold CTRL, and then select all of the animation effects. Under Modify: Expand, in the Start list, select With Previous. Press and hold CTRL, and then select the third, fifth, and seventh animation effects. Under Modify: Expand, in the Start list, select On Click. Press and hold CTRL, and then select the second, fourth, sixth and eighth animation effects (expand effects for the larger, second-level rectangles). Click Change, point to Entrance, and then click More Effects. In the Change Entrance Effect dialog box, under Moderate, click Compress. To reproduce the background effects on this slide, do the following: Right-click the slide background area, and then click Format Background. In the Format Background dialog box, click Fill in the left pane, select Gradient fill in the Fill pane, and then do the following: Click the button next to Direction, and then click Linear Down (first row, second option from the left). Also under Gradient stops, customize the gradient stops that you added as follows: Click the button next to Color, and then under Theme Colors click Black, Text 1 (first row, second option from the left). In the Stop position box, enter 63%. Click the button next to Color, and then under Theme Colors click Black, Text 1, Lighter 50% (second row, second option from the left).")
18
Hanseníase segundo UF de residência e Região, Brasil, 2013.
UF Residencia Casos Novos Coef.Detec Registro Ativo Coef.Preva Região Norte 6.906 42,24 5.614 3,43 Rondônia 813 51,13 639 4,02 Acre 178 23,46 139 1,83 Amazonas 664 18,49 613 1,71 Roraima 148 31,10 113 2,41 Para 3912 50,01 3.185 4,07 Amapá 152 21,76 140 2,00 Tocantins 1041 785 5,54 Nordeste 13.896 25,78 12.477 2,31 Maranhão 3.729 55,54 3.597 5,22 Piaui 1.061 33,57 879 2,78 Ceara 2.136 24,62 1.909 2,22 RGNorte 318 9,85 271 0,84 Paraiba 707 18,53 534 1,40 Pernambuco 2.470 27,66 2.376 2,66 Alagoas 456 14,41 322 1,02 Sergipe 476 22,58 316 1,50 Bahia 2.543 17,94 2.316 1,67 Sudeste 5.386 6,60 4.628 0,57 Minas Gerais 1.464 7,37 1.279 0,64 Espirito Santo 783 21,88 624 1,74 Rio de Janeiro 1.510 9,30 1.317 0,81 São Paulo 1.629 3,89 1.408 0,34 Sul 1.340 4,83 1587 0,44 Paraná 989 9,35 894 0,85 Santa Catarina 204 3,20 185 0,29 Rio Grande Sul 147 1,36 134 0,12 Centro Oeste 5.775 40,04 5.379 3,73 Mato Grosso Sul 878 34,97 897 3,58 Mato Grosso 2.503 80,34 2.395 7,69 Goias 2.205 35,82 1.847 3,00 Distrito Federal 191 7,21 240 0,91 Brasil 33.303 17,17 29.311 1,51 Hanseníase segundo UF de residência e Região, Brasil, 2013.

19
FONTE: ATDS/DAB/SPS/MS; SES; IBGE
Distribuição das UFs segundo níveis endêmicos Brasil 2013 Amapá Roraima Acre Amapá Ceará Amazonas Pará Maranhão Rio Grande do Norte Roraima Piauí Paraíba Acre Tocantins Pernambuco Rondônia Alagoas Ceará Sergipe Amazonas Pará Maranhão Mato Grosso Bahia Distrito Federal Rio Grande do Norte Piauí Paraíba Goiás Minas Gerais Pernambuco Minas Gerais Mato Grosso do Sul Rondônia Tocantins Alagoas Espírito Santo Mato Grosso Bahia Sergipe Distrito Federal Rio de Janeiro Minas Gerais Goiás Paraná Paraná SãoPaulo Minas Gerais Mato Grosso do Sul Espírito Santo Santa Catarina Rio Grande do Sul Rio de Janeiro Paraná Paraná SãoPaulo Santa Catarina Rio Grande do Sul FONTE: ATDS/DAB/SPS/MS; SES; IBGE

22
Estado de São Paulo

23
Situação Epidemiológica, Estado de São Paulo,1988-14.
Secretaria de Estado da Saúde Coordenadoria de Controle de Doenças Centro de Vigilância Epidemiológica Prof “Alexandre Vranjac”. Divisão de Vigilância Epidemiológica em Hanseníase Programa de Controle da Hanseníase Situação Epidemiológica, Estado de São Paulo,

25
GVE-Residência N.Casos Coef.Prev GVE XXX JALES 82 3,09 GVE XXVIII CARAGUATATUBA 78 2,55 GVE XXII PRES.VENCESLAU 49 1,65 GVE XXIV RIBEIRÃO PRETO 173 1,22 GVE XI ARAÇATUBA 84 1,11 GVE XXI PRES.PRUDENTE 48 1,05 GVE XIV BARRETOS 39 0,91 GVE XXIX S J DO RIO PRETO 106 0,82 GVE XXIII REGISTRO 22 0,78 GVE XVIII FRANCA 53 0,77 GVE XIX MARÍLIA 0,75 GVE XIII ASSIS 25 0,53 GVE XXV SANTOS 92 0,52 GVE XXXI SOROCABA 107 0,51 GVE XX PIRACICABA 70 0,47 GVE XVI BOTUCATU 26 0,44 GVE XII ARARAQUARA 42 0,43 GVE XVII CAMPINAS 185 GVE XXXIII TAUBATÉ 44 0,41 GVE XV BAURU 43 0,38 GVE X OSASCO 100 0,35 GVE XXVI S J DA BOA VISTA 28 GVE VII STO ANDRÉ 74 0,28 GVE IX FRANCO DA ROCHA 14 0,25 GVE XXVII S J DOS CAMPOS GVE VIII MOGI DAS CRUZES 62 0,22 GVE XXXII ITAPEVA 6 0,21 GVE I CAPITAL 219 0,19 Total 1945 0,45 Fonte:DTVEH/CVE/CCD/SES Nota População Estimada IBGE-2013 Prevalência de Hanseníase segundo GVE de residência, Estado de São Paulo, 2014.

26
Prevalência de Hanseníase segundo Município de residência, Estado de São Paulo, 2014.

27
Casos Novos Detectados de Hanseníase, Estado de São Paulo, 2014
Detecção de Casos Novos Médio 3,30/ hab. Médio Custom animation effects: object spins on end (Advanced) To reproduce the background effects on this slide, do the following: Right-click the slide background area, and then click Format Background. In the Format Background dialog box, click Fill in the left pane, and then select Solid fill in the Fill pane. Click the button next to Color, and then under Theme Colors click White, Background 1 (first row, first option from the left). On the Home tab, in the Slides group, click Layout, and then click Blank. To reproduce the rectangle on this slide, do the following: With the rounded rectangle still selected, under Drawing Tools, on the Format tab, in the Size group, do the following: Select the rectangle. Drag the yellow diamond adjustment handle to the left to decrease the amount of rounding on the corners. On the Home tab, in the Drawing group, click Shapes, and then under Rectangles click Rounded Rectangle (second option from the left). On the slide, drag to draw a rounded rectangle. In the Shape Height box, enter 3.5”. Under Drawing Tools, on the Format tab, in the bottom right corner of the Shape Styles group, click the Format Shape dialog box launcher. In the Format Shape dialog box, click Fill in the left pane. In the Fill pane, select Solid fill, click the button next to Color, and then under Theme Colors click White, Background 1, Darker 15% (third row, first option from the left). In the Shape Width box, enter 0.25”. Also in the Format Shape dialog box, click Shadow in the left pane. In the Shadow pane, click the button next to Presets, under Outer select Offset Bottom (first row, second option from the left), and then do the following: Also in the Format Shape dialog box, click Line Color in the left pane. In the Line Color pane, select No line. In the Blur box, enter 8.5 pt. In the Size box, enter 100%. In the Transparency box, enter 0%. Also in the Format Shape dialog box, click 3-D Format in the left pane. In the 3-D Format pane, do the following: In the Distance box, enter 1 pt. In the Angle box, enter 90°. Under Surface, click the button next to Material, and then under Standard click Matte (first row, first option from the left). Click the button next to Lighting, and then under Neutral click Soft (first row, third option from the left). Under Bevel, click the button next to Top, and then under Bevel click Circle (first row, first option from the left). Next to Top, in the Width box, enter 5 pt, and in the Height box, enter 5 pt. Select the duplicate rectangle. On the Home tab, in the Drawing group, do the following: On the slide, select the rounded rectangle. On the Home tab, in the Clipboard group, click the arrow under Paste, and then click Duplicate. Click the arrow next to Shape Fill, and then click No Fill. Press and hold CTRL, and then select both rectangles. On the Home tab, in the Drawing group, click Arrange, and do the following: Drag the second rectangle above the first rectangle until the lower edge overlays the top edge of the first rectangle. (Note: When the spinning animation effect is created later for these rectangles, the spin will center where the edges of the rectangles meet.) Click the arrow next to Shape Outline, and then click No Outline. Point to Align, and then click Align Center. Point to Align, and then click Align Selected Objects. On the Home tab, in the Drawing group, click Arrange, point to Align, and then do the following: On the slide, drag the group until it is centered horizontally on the left edge of the slide (straddling the edge). Click Group. Click Align Middle. Click Align to Slide. To reproduce the dashed arc on this slide, do the following: On the Home tab, in the Drawing group, click Shapes, and then under Basic Shapes click Arc (third row, 12th option from the left). On the slide, drag to draw an arc. Select the arc. Under Drawing Tools, on the Format tab, in the Size group, do the following: With the arc still selected, on the Home tab, in the Drawing group, click the arrow next to Shape Outline, and then do the following: In the Shape Width box, enter 7.5”. In the Shape Height box, enter 7.5”. Under Theme Colors, click White, Background 1, Darker 15% (third row, first option from the left). Drag the arc until the yellow diamond adjustment handles are on the left edge of the slide. On the slide, drag the yellow diamond adjustment handle on the right side of the arc to the bottom of the arc to create a half circle. Point to Dashes, and then click Dash (fourth option from the top). With the arc still selected, on the Home tab, in the Drawing group, click Arrange, point to Align, and then do the following: To reproduce the half circle on this slide, do the following: Select the duplicate arc. Under Drawing Tools, on the Format tab, in the Size group, do the following: On the slide, select the arc. On the Home tab, in the Clipboard group, click the arrow under Paste, and then click Duplicate. In the Shape Height box, enter 3.33”. Under Drawing Tools, on the Format tab, in the Shape Styles group, click the arrow next to Shape Outline, and then click No Outline. With the second arc still selected, under Drawing Tools, on the Format tab, in the Shape Styles group, click the arrow next to Shape Fill, and then under Theme Colors click White, Background 1, Darker 5% (second row, first option from the left). In the Shape Width box, enter 3.33”. Under Drawing Tools, on the Format tab, in the Shape Styles group, click Shape Effects, point to Shadow, and then click Shadow Options. In the Format Shape dialog box, click Shadow in the left pane. In the Shadow pane, click the button next to Presets, under Inner click Inside Right (second row, third option from the left), and then do the following: In the Angle box, enter 315°. In the Blur box, enter 24 pt. In the Transparency box, enter 86%. On the slide, drag the second arc until the yellow diamond adjustment handles are on the left edge of the slide. On the Home tab, in the Drawing group, click Arrange, and then do the following: In the Distance box, enter 4 pt. Point to Align, and then click Align Middle. Point to Align, and then click Align to Slide. Click Send to Back. To reproduce the button shapes on this slide, do the following: Select the oval. Under Drawing Tools, on the Format tab, in the Size group, do the following: On the Home tab, in the Drawing group, click Shapes, and then under Basic Shapes click Oval (first row, second option from the left). On the slide, drag to draw an oval. In the Shape Height box, enter 0.34”. Under Drawing Tools, on the Format tab, in the bottom right corner of the Shape Styles group, click the Format Shape dialog box launcher. In the Format Shape dialog box, click Fill in the left pane. In the Fill pane, select Solid Fill. Click the button next to Color, and then under Theme Colors click Olive Green, Accent 3, Lighter 80° (second row, seventh option from the left). Under Drawing Tools, on the Format tab, in the Shape Styles group, click More, and then click Light 1 Outline, Colored Fill – Dark 1 (third row, first option from the left). In the Shape Width box, enter 0.34”. Also in the Format Shape dialog box, click Shadow in the left pane. In the Shadow pane, click the button next to Presets, under Outer click Offset Bottom (first row, second option from the left), and then do the following: Also in the Format Shape dialog box, click 3-D Format in the left pane, and then do the following in the 3-D Format pane: Under Contour, click the button next to Color, and then under Theme Colors click White, Background 1 (first row, first option from the left). In the Size box, enter 3.5 pt. Under Bevel, click the button next to Top, and then under Bevel click Art Deco (third row, fourth option from the left). Next to Top, in the Width box, enter 5 pt, and in the Height box, enter 5 pt. On the slide, select the oval. Under Drawing Tools, on the Format tab, in the bottom right corner of the Size group, click the Size and Position dialog box launcher. In the Size and Position dialog box, on the Position tab, do the following: Select the oval. On the Home tab, in the Clipboard group, click the arrow under Paste, and then click Duplicate. In the Vertical box, enter 1.5”. In the Horizontal box, enter 2.98”. Select the duplicate oval. Under Drawing Tools, on the Format tab, in the bottom right corner of the Size group, click the Size and Position dialog box launcher. In the Size and Position dialog box, on the Position tab, do the following: In the Horizontal box, enter 3.52”. Repeat step 9 two more times, for a total of four ovals. Under Drawing Tools, on the Format tab, in the bottom right corner of the Size group, click the Size and Position dialog box launcher. In the Size and Position dialog box, on the Position tab, do the following to position the third and fourth ovals: In the Vertical box, enter 2.98”. Select the fourth oval on the slide, and then enter 2.99” in the Horizontal box and 5.66” in the Vertical box. Select the third oval on the slide, and then enter 3.52” in the Horizontal box and 4.27” in the Vertical box. To reproduce the text on this slide, do the following: On the Insert tab, in the Text group, click Text Box, and then on the slide, drag to draw the text box. Enter text in the text box and select the text. On the Home tab, in the Font group, do the following: In the Font list, select Corbel. On the Home tab, in the Paragraph group, click Align Text Left to align the text left in the text box. Click the arrow next to Font Color, and then under Theme Colors click White, Background 1, Darker 50% (sixth row, first option from the left). In the Font Size list, select 22. On the slide, drag the text box to the right of the first oval. Drag the second text box to the right of the second oval. Click in the text box and edit the text. Select the text box. On the Home tab, in the Clipboard group, click the arrow under Paste, and then click Duplicate. Repeat steps 5-7 to create the third and fourth text boxes, dragging them to the right of the third and fourth ovals. To reproduce the animation effects on this slide, do the following: On the Home tab, in the Editing group, click Select, and then click Selection Pane. On the Animations tab, in the Animations group, click Custom Animation. In the Selection and Visibility pane, select the rectangle group. In the Custom Animation task pane, do the following: Select the animation effect (spin effect for the rectangle group). Under Modify: Spin, do the following: Click Add Effect, point to Emphasis, and then click More Effects. In the Add Emphasis Effect dialog box, under Basic, click Spin. In the Amount list, in the Custom box, enter 123°, and then press ENTER. Also in the Amount list, click Counterclockwise. In the Start list, select With Previous. On the slide, select the first oval. In the Custom Animation task pane, do the following: In the Speed list, select Fast. Select the second animation effect (change fill color effect for the first oval). Under Modify: Change Fill Color, do the following: Click Add Effect, point to Emphasis, and then click More Effects. In the Add Emphasis Effect dialog box, under Basic, click Change Fill Color. In the Start list, select After Previous. On the slide, select the first text box. In the Custom Animation task pane, do the following: In the Speed list, select Very Fast. In the Fill Color list, click More Colors. In the Colors dialog box, on the Custom tab, enter values for Red: 130, Green: 153, Blue: 117. Select the third animation effect (fade effect for the first text box). Under Modify: Fade, do the following: Click Add Effect, point to Entrance, and then click More Effects. In the Add Entrance Effect dialog box, under Subtle, click Fade. Select the fourth animation effect (spin effect for the rectangle group). Under Modify: Spin, do the following: In the Start list, select On Click. In the Amount list, in the Custom box, enter 22°, and then press ENTER. Also in the Amount list, click Clockwise. On the slide, select the second oval. In the Custom Animation task pane, do the following: Select the fifth animation effect (change fill color effect for the second oval). Under Modify: Change Fill Color, do the following: On the slide, select the second text box. In the Custom Animation task pane, do the following: Select the sixth animation effect (fade effect for the second text box). Under Modify: Fade, do the following: Click Add Effect, point to Entrance and then click More Effects. In the Add Entrance Effect dialog box, under Subtle, click Fade. On the slide, select the third oval. In the Custom Animation task pane, do the following: Select the seventh animation effect (change fill color effect for the third oval). Under Modify: Change Fill Color, do the following: On the slide, select the third text box. In the Custom Animation task pane, do the following: Select the eighth animation effect (fade effect for the third text box). Under Modify: Fade, do the following: On the slide, select the fourth oval. In the Custom Animation task pane, do the following: Select the ninth animation effect (change fill color effect for the fourth oval). Under Modify: Change Fill Color, do the following: On the slide, select the fourth text box. In the Custom Animation task pane, do the following: Select the 10th animation effect (fade effect for the fourth text box). Under Modify: Fade, do the following: 56,75% de municípios com baixa detecção de casos novos
 To reproduce the background effects on this slide, do the following: Right-click the slide background area, and then click Format Background. In the Format Background dialog box, click Fill in the left pane, and then select Solid fill in the Fill pane. Click the button next to Color, and then under Theme Colors click White, Background 1 (first row, first option from the left). On the Home tab, in the Slides group, click Layout, and then click Blank. To reproduce the rectangle on this slide, do the following: With the rounded rectangle still selected, under Drawing Tools, on the Format tab, in the Size group, do the following: Select the rectangle. Drag the yellow diamond adjustment handle to the left to decrease the amount of rounding on the corners. On the Home tab, in the Drawing group, click Shapes, and then under Rectangles click Rounded Rectangle (second option from the left). On the slide, drag to draw a rounded rectangle. In the Shape Height box, enter Under Drawing Tools, on the Format tab, in the bottom right corner of the Shape Styles group, click the Format Shape dialog box launcher. In the Format Shape dialog box, click Fill in the left pane. In the Fill pane, select Solid fill, click the button next to Color, and then under Theme Colors click White, Background 1, Darker 15% (third row, first option from the left). In the Shape Width box, enter Also in the Format Shape dialog box, click Shadow in the left pane. In the Shadow pane, click the button next to Presets, under Outer select Offset Bottom (first row, second option from the left), and then do the following: Also in the Format Shape dialog box, click Line Color in the left pane. In the Line Color pane, select No line. In the Blur box, enter 8.5 pt. In the Size box, enter 100%. In the Transparency box, enter 0%. Also in the Format Shape dialog box, click 3-D Format in the left pane. In the 3-D Format pane, do the following: In the Distance box, enter 1 pt. In the Angle box, enter 90°. Under Surface, click the button next to Material, and then under Standard click Matte (first row, first option from the left). Click the button next to Lighting, and then under Neutral click Soft (first row, third option from the left). Under Bevel, click the button next to Top, and then under Bevel click Circle (first row, first option from the left). Next to Top, in the Width box, enter 5 pt, and in the Height box, enter 5 pt. Select the duplicate rectangle. On the Home tab, in the Drawing group, do the following: On the slide, select the rounded rectangle. On the Home tab, in the Clipboard group, click the arrow under Paste, and then click Duplicate. Click the arrow next to Shape Fill, and then click No Fill. Press and hold CTRL, and then select both rectangles. On the Home tab, in the Drawing group, click Arrange, and do the following: Drag the second rectangle above the first rectangle until the lower edge overlays the top edge of the first rectangle. (Note: When the spinning animation effect is created later for these rectangles, the spin will center where the edges of the rectangles meet.) Click the arrow next to Shape Outline, and then click No Outline. Point to Align, and then click Align Center. Point to Align, and then click Align Selected Objects. On the Home tab, in the Drawing group, click Arrange, point to Align, and then do the following: On the slide, drag the group until it is centered horizontally on the left edge of the slide (straddling the edge). Click Group. Click Align Middle. Click Align to Slide. To reproduce the dashed arc on this slide, do the following: On the Home tab, in the Drawing group, click Shapes, and then under Basic Shapes click Arc (third row, 12th option from the left). On the slide, drag to draw an arc. Select the arc. Under Drawing Tools, on the Format tab, in the Size group, do the following: With the arc still selected, on the Home tab, in the Drawing group, click the arrow next to Shape Outline, and then do the following: In the Shape Width box, enter In the Shape Height box, enter Under Theme Colors, click White, Background 1, Darker 15% (third row, first option from the left). Drag the arc until the yellow diamond adjustment handles are on the left edge of the slide. On the slide, drag the yellow diamond adjustment handle on the right side of the arc to the bottom of the arc to create a half circle. Point to Dashes, and then click Dash (fourth option from the top). With the arc still selected, on the Home tab, in the Drawing group, click Arrange, point to Align, and then do the following: To reproduce the half circle on this slide, do the following: Select the duplicate arc. Under Drawing Tools, on the Format tab, in the Size group, do the following: On the slide, select the arc. On the Home tab, in the Clipboard group, click the arrow under Paste, and then click Duplicate. In the Shape Height box, enter Under Drawing Tools, on the Format tab, in the Shape Styles group, click the arrow next to Shape Outline, and then click No Outline. With the second arc still selected, under Drawing Tools, on the Format tab, in the Shape Styles group, click the arrow next to Shape Fill, and then under Theme Colors click White, Background 1, Darker 5% (second row, first option from the left). In the Shape Width box, enter Under Drawing Tools, on the Format tab, in the Shape Styles group, click Shape Effects, point to Shadow, and then click Shadow Options. In the Format Shape dialog box, click Shadow in the left pane. In the Shadow pane, click the button next to Presets, under Inner click Inside Right (second row, third option from the left), and then do the following: In the Angle box, enter 315°. In the Blur box, enter 24 pt. In the Transparency box, enter 86%. On the slide, drag the second arc until the yellow diamond adjustment handles are on the left edge of the slide. On the Home tab, in the Drawing group, click Arrange, and then do the following: In the Distance box, enter 4 pt. Point to Align, and then click Align Middle. Point to Align, and then click Align to Slide. Click Send to Back. To reproduce the button shapes on this slide, do the following: Select the oval. Under Drawing Tools, on the Format tab, in the Size group, do the following: On the Home tab, in the Drawing group, click Shapes, and then under Basic Shapes click Oval (first row, second option from the left). On the slide, drag to draw an oval. In the Shape Height box, enter Under Drawing Tools, on the Format tab, in the bottom right corner of the Shape Styles group, click the Format Shape dialog box launcher. In the Format Shape dialog box, click Fill in the left pane. In the Fill pane, select Solid Fill. Click the button next to Color, and then under Theme Colors click Olive Green, Accent 3, Lighter 80° (second row, seventh option from the left). Under Drawing Tools, on the Format tab, in the Shape Styles group, click More, and then click Light 1 Outline, Colored Fill – Dark 1 (third row, first option from the left). In the Shape Width box, enter Also in the Format Shape dialog box, click Shadow in the left pane. In the Shadow pane, click the button next to Presets, under Outer click Offset Bottom (first row, second option from the left), and then do the following: Also in the Format Shape dialog box, click 3-D Format in the left pane, and then do the following in the 3-D Format pane: Under Contour, click the button next to Color, and then under Theme Colors click White, Background 1 (first row, first option from the left). In the Size box, enter 3.5 pt. Under Bevel, click the button next to Top, and then under Bevel click Art Deco (third row, fourth option from the left). Next to Top, in the Width box, enter 5 pt, and in the Height box, enter 5 pt. On the slide, select the oval. Under Drawing Tools, on the Format tab, in the bottom right corner of the Size group, click the Size and Position dialog box launcher. In the Size and Position dialog box, on the Position tab, do the following: Select the oval. On the Home tab, in the Clipboard group, click the arrow under Paste, and then click Duplicate. In the Vertical box, enter In the Horizontal box, enter Select the duplicate oval. Under Drawing Tools, on the Format tab, in the bottom right corner of the Size group, click the Size and Position dialog box launcher. In the Size and Position dialog box, on the Position tab, do the following: In the Horizontal box, enter Repeat step 9 two more times, for a total of four ovals. Under Drawing Tools, on the Format tab, in the bottom right corner of the Size group, click the Size and Position dialog box launcher. In the Size and Position dialog box, on the Position tab, do the following to position the third and fourth ovals: In the Vertical box, enter Select the fourth oval on the slide, and then enter 2.99 in the Horizontal box and 5.66 in the Vertical box. Select the third oval on the slide, and then enter 3.52 in the Horizontal box and 4.27 in the Vertical box. To reproduce the text on this slide, do the following: On the Insert tab, in the Text group, click Text Box, and then on the slide, drag to draw the text box. Enter text in the text box and select the text. On the Home tab, in the Font group, do the following: In the Font list, select Corbel. On the Home tab, in the Paragraph group, click Align Text Left to align the text left in the text box. Click the arrow next to Font Color, and then under Theme Colors click White, Background 1, Darker 50% (sixth row, first option from the left). In the Font Size list, select 22. On the slide, drag the text box to the right of the first oval. Drag the second text box to the right of the second oval. Click in the text box and edit the text. Select the text box. On the Home tab, in the Clipboard group, click the arrow under Paste, and then click Duplicate. Repeat steps 5-7 to create the third and fourth text boxes, dragging them to the right of the third and fourth ovals. To reproduce the animation effects on this slide, do the following: On the Home tab, in the Editing group, click Select, and then click Selection Pane. On the Animations tab, in the Animations group, click Custom Animation. In the Selection and Visibility pane, select the rectangle group. In the Custom Animation task pane, do the following: Select the animation effect (spin effect for the rectangle group). Under Modify: Spin, do the following: Click Add Effect, point to Emphasis, and then click More Effects. In the Add Emphasis Effect dialog box, under Basic, click Spin. In the Amount list, in the Custom box, enter 123°, and then press ENTER. Also in the Amount list, click Counterclockwise. In the Start list, select With Previous. On the slide, select the first oval. In the Custom Animation task pane, do the following: In the Speed list, select Fast. Select the second animation effect (change fill color effect for the first oval). Under Modify: Change Fill Color, do the following: Click Add Effect, point to Emphasis, and then click More Effects. In the Add Emphasis Effect dialog box, under Basic, click Change Fill Color. In the Start list, select After Previous. On the slide, select the first text box. In the Custom Animation task pane, do the following: In the Speed list, select Very Fast. In the Fill Color list, click More Colors. In the Colors dialog box, on the Custom tab, enter values for Red: 130, Green: 153, Blue: 117. Select the third animation effect (fade effect for the first text box). Under Modify: Fade, do the following: Click Add Effect, point to Entrance, and then click More Effects. In the Add Entrance Effect dialog box, under Subtle, click Fade. Select the fourth animation effect (spin effect for the rectangle group). Under Modify: Spin, do the following: In the Start list, select On Click. In the Amount list, in the Custom box, enter 22°, and then press ENTER. Also in the Amount list, click Clockwise. On the slide, select the second oval. In the Custom Animation task pane, do the following: Select the fifth animation effect (change fill color effect for the second oval). Under Modify: Change Fill Color, do the following: On the slide, select the second text box. In the Custom Animation task pane, do the following: Select the sixth animation effect (fade effect for the second text box). Under Modify: Fade, do the following: Click Add Effect, point to Entrance and then click More Effects. In the Add Entrance Effect dialog box, under Subtle, click Fade. On the slide, select the third oval. In the Custom Animation task pane, do the following: Select the seventh animation effect (change fill color effect for the third oval). Under Modify: Change Fill Color, do the following: On the slide, select the third text box. In the Custom Animation task pane, do the following: Select the eighth animation effect (fade effect for the third text box). Under Modify: Fade, do the following: On the slide, select the fourth oval. In the Custom Animation task pane, do the following: Select the ninth animation effect (change fill color effect for the fourth oval). Under Modify: Change Fill Color, do the following: On the slide, select the fourth text box. In the Custom Animation task pane, do the following: Select the 10th animation effect (fade effect for the fourth text box). Under Modify: Fade, do the following: 56,75% de municípios com baixa detecção de casos novos.")
28
Distribuição de municípios do segundo o nível de detecção de hanseníase(1),Estado São Paulo, 2014 Detecção Maior de 40,0 De 10,0 a 40,00 Sub-Total Menor de 10,0 Sem Detecção 2006 Nº 31 136 167 478 288 % 4,81 21,09 25,89 74,11 44,65 2007 27 149 176 469 299 4,19 23,1 27,29 72,71 46,36 2008 16 161 201 458 257 2,48 24,96 31,16 71,01 39,84 2009 17 117 134 511 320 2,63 18,13 20,76 79,23 49,61 2010 25 113 138 507 311 3,88 17,52 21,4 78,6 48,22 2011 127 143 502 310 19,69 22,17 77,83 48,06 2012 32 100 132 513 316 4,96 15,5 20,47 79,53 48,99 2013 20 305 3,1 20,5 79,5 47,29 2014 19 97 116 529 327 3,95 15,04 17,99 81,09 50,7 (1) p/ hab.
 p/ hab.")
30
Detecção de Casos Novos em Menores de 15 anos
Inserção: Programa Mais Saúde:Direito de Todos Programa de Aceleração do Crescimento(PAC) Detecção de Casos Novos em Menores de 15 anos Importância:Expressa a transmissão recente e os focos ativos da doença. Meta:Reduzir em 26,9% até 2015 (a contar de 2008). Custom animation effects: object spins on end (Advanced) To reproduce the background effects on this slide, do the following: Right-click the slide background area, and then click Format Background. In the Format Background dialog box, click Fill in the left pane, and then select Solid fill in the Fill pane. Click the button next to Color, and then under Theme Colors click White, Background 1 (first row, first option from the left). On the Home tab, in the Slides group, click Layout, and then click Blank. To reproduce the rectangle on this slide, do the following: With the rounded rectangle still selected, under Drawing Tools, on the Format tab, in the Size group, do the following: Select the rectangle. Drag the yellow diamond adjustment handle to the left to decrease the amount of rounding on the corners. On the Home tab, in the Drawing group, click Shapes, and then under Rectangles click Rounded Rectangle (second option from the left). On the slide, drag to draw a rounded rectangle. In the Shape Height box, enter 3.5”. Under Drawing Tools, on the Format tab, in the bottom right corner of the Shape Styles group, click the Format Shape dialog box launcher. In the Format Shape dialog box, click Fill in the left pane. In the Fill pane, select Solid fill, click the button next to Color, and then under Theme Colors click White, Background 1, Darker 15% (third row, first option from the left). In the Shape Width box, enter 0.25”. Also in the Format Shape dialog box, click Shadow in the left pane. In the Shadow pane, click the button next to Presets, under Outer select Offset Bottom (first row, second option from the left), and then do the following: Also in the Format Shape dialog box, click Line Color in the left pane. In the Line Color pane, select No line. In the Blur box, enter 8.5 pt. In the Size box, enter 100%. In the Transparency box, enter 0%. Also in the Format Shape dialog box, click 3-D Format in the left pane. In the 3-D Format pane, do the following: In the Distance box, enter 1 pt. In the Angle box, enter 90°. Under Surface, click the button next to Material, and then under Standard click Matte (first row, first option from the left). Click the button next to Lighting, and then under Neutral click Soft (first row, third option from the left). Under Bevel, click the button next to Top, and then under Bevel click Circle (first row, first option from the left). Next to Top, in the Width box, enter 5 pt, and in the Height box, enter 5 pt. Select the duplicate rectangle. On the Home tab, in the Drawing group, do the following: On the slide, select the rounded rectangle. On the Home tab, in the Clipboard group, click the arrow under Paste, and then click Duplicate. Click the arrow next to Shape Fill, and then click No Fill. Press and hold CTRL, and then select both rectangles. On the Home tab, in the Drawing group, click Arrange, and do the following: Drag the second rectangle above the first rectangle until the lower edge overlays the top edge of the first rectangle. (Note: When the spinning animation effect is created later for these rectangles, the spin will center where the edges of the rectangles meet.) Click the arrow next to Shape Outline, and then click No Outline. Point to Align, and then click Align Center. Point to Align, and then click Align Selected Objects. On the Home tab, in the Drawing group, click Arrange, point to Align, and then do the following: On the slide, drag the group until it is centered horizontally on the left edge of the slide (straddling the edge). Click Group. Click Align Middle. Click Align to Slide. To reproduce the dashed arc on this slide, do the following: On the Home tab, in the Drawing group, click Shapes, and then under Basic Shapes click Arc (third row, 12th option from the left). On the slide, drag to draw an arc. Select the arc. Under Drawing Tools, on the Format tab, in the Size group, do the following: With the arc still selected, on the Home tab, in the Drawing group, click the arrow next to Shape Outline, and then do the following: In the Shape Width box, enter 7.5”. In the Shape Height box, enter 7.5”. Under Theme Colors, click White, Background 1, Darker 15% (third row, first option from the left). Drag the arc until the yellow diamond adjustment handles are on the left edge of the slide. On the slide, drag the yellow diamond adjustment handle on the right side of the arc to the bottom of the arc to create a half circle. Point to Dashes, and then click Dash (fourth option from the top). With the arc still selected, on the Home tab, in the Drawing group, click Arrange, point to Align, and then do the following: To reproduce the half circle on this slide, do the following: Select the duplicate arc. Under Drawing Tools, on the Format tab, in the Size group, do the following: On the slide, select the arc. On the Home tab, in the Clipboard group, click the arrow under Paste, and then click Duplicate. In the Shape Height box, enter 3.33”. Under Drawing Tools, on the Format tab, in the Shape Styles group, click the arrow next to Shape Outline, and then click No Outline. With the second arc still selected, under Drawing Tools, on the Format tab, in the Shape Styles group, click the arrow next to Shape Fill, and then under Theme Colors click White, Background 1, Darker 5% (second row, first option from the left). In the Shape Width box, enter 3.33”. Under Drawing Tools, on the Format tab, in the Shape Styles group, click Shape Effects, point to Shadow, and then click Shadow Options. In the Format Shape dialog box, click Shadow in the left pane. In the Shadow pane, click the button next to Presets, under Inner click Inside Right (second row, third option from the left), and then do the following: In the Angle box, enter 315°. In the Blur box, enter 24 pt. In the Transparency box, enter 86%. On the slide, drag the second arc until the yellow diamond adjustment handles are on the left edge of the slide. On the Home tab, in the Drawing group, click Arrange, and then do the following: In the Distance box, enter 4 pt. Point to Align, and then click Align Middle. Point to Align, and then click Align to Slide. Click Send to Back. To reproduce the button shapes on this slide, do the following: Select the oval. Under Drawing Tools, on the Format tab, in the Size group, do the following: On the Home tab, in the Drawing group, click Shapes, and then under Basic Shapes click Oval (first row, second option from the left). On the slide, drag to draw an oval. In the Shape Height box, enter 0.34”. Under Drawing Tools, on the Format tab, in the bottom right corner of the Shape Styles group, click the Format Shape dialog box launcher. In the Format Shape dialog box, click Fill in the left pane. In the Fill pane, select Solid Fill. Click the button next to Color, and then under Theme Colors click Olive Green, Accent 3, Lighter 80° (second row, seventh option from the left). Under Drawing Tools, on the Format tab, in the Shape Styles group, click More, and then click Light 1 Outline, Colored Fill – Dark 1 (third row, first option from the left). In the Shape Width box, enter 0.34”. Also in the Format Shape dialog box, click Shadow in the left pane. In the Shadow pane, click the button next to Presets, under Outer click Offset Bottom (first row, second option from the left), and then do the following: Also in the Format Shape dialog box, click 3-D Format in the left pane, and then do the following in the 3-D Format pane: Under Contour, click the button next to Color, and then under Theme Colors click White, Background 1 (first row, first option from the left). In the Size box, enter 3.5 pt. Under Bevel, click the button next to Top, and then under Bevel click Art Deco (third row, fourth option from the left). Next to Top, in the Width box, enter 5 pt, and in the Height box, enter 5 pt. On the slide, select the oval. Under Drawing Tools, on the Format tab, in the bottom right corner of the Size group, click the Size and Position dialog box launcher. In the Size and Position dialog box, on the Position tab, do the following: Select the oval. On the Home tab, in the Clipboard group, click the arrow under Paste, and then click Duplicate. In the Vertical box, enter 1.5”. In the Horizontal box, enter 2.98”. Select the duplicate oval. Under Drawing Tools, on the Format tab, in the bottom right corner of the Size group, click the Size and Position dialog box launcher. In the Size and Position dialog box, on the Position tab, do the following: In the Horizontal box, enter 3.52”. Repeat step 9 two more times, for a total of four ovals. Under Drawing Tools, on the Format tab, in the bottom right corner of the Size group, click the Size and Position dialog box launcher. In the Size and Position dialog box, on the Position tab, do the following to position the third and fourth ovals: In the Vertical box, enter 2.98”. Select the fourth oval on the slide, and then enter 2.99” in the Horizontal box and 5.66” in the Vertical box. Select the third oval on the slide, and then enter 3.52” in the Horizontal box and 4.27” in the Vertical box. To reproduce the text on this slide, do the following: On the Insert tab, in the Text group, click Text Box, and then on the slide, drag to draw the text box. Enter text in the text box and select the text. On the Home tab, in the Font group, do the following: In the Font list, select Corbel. On the Home tab, in the Paragraph group, click Align Text Left to align the text left in the text box. Click the arrow next to Font Color, and then under Theme Colors click White, Background 1, Darker 50% (sixth row, first option from the left). In the Font Size list, select 22. On the slide, drag the text box to the right of the first oval. Drag the second text box to the right of the second oval. Click in the text box and edit the text. Select the text box. On the Home tab, in the Clipboard group, click the arrow under Paste, and then click Duplicate. Repeat steps 5-7 to create the third and fourth text boxes, dragging them to the right of the third and fourth ovals. To reproduce the animation effects on this slide, do the following: On the Home tab, in the Editing group, click Select, and then click Selection Pane. On the Animations tab, in the Animations group, click Custom Animation. In the Selection and Visibility pane, select the rectangle group. In the Custom Animation task pane, do the following: Select the animation effect (spin effect for the rectangle group). Under Modify: Spin, do the following: Click Add Effect, point to Emphasis, and then click More Effects. In the Add Emphasis Effect dialog box, under Basic, click Spin. In the Amount list, in the Custom box, enter 123°, and then press ENTER. Also in the Amount list, click Counterclockwise. In the Start list, select With Previous. On the slide, select the first oval. In the Custom Animation task pane, do the following: In the Speed list, select Fast. Select the second animation effect (change fill color effect for the first oval). Under Modify: Change Fill Color, do the following: Click Add Effect, point to Emphasis, and then click More Effects. In the Add Emphasis Effect dialog box, under Basic, click Change Fill Color. In the Start list, select After Previous. On the slide, select the first text box. In the Custom Animation task pane, do the following: In the Speed list, select Very Fast. In the Fill Color list, click More Colors. In the Colors dialog box, on the Custom tab, enter values for Red: 130, Green: 153, Blue: 117. Select the third animation effect (fade effect for the first text box). Under Modify: Fade, do the following: Click Add Effect, point to Entrance, and then click More Effects. In the Add Entrance Effect dialog box, under Subtle, click Fade. Select the fourth animation effect (spin effect for the rectangle group). Under Modify: Spin, do the following: In the Start list, select On Click. In the Amount list, in the Custom box, enter 22°, and then press ENTER. Also in the Amount list, click Clockwise. On the slide, select the second oval. In the Custom Animation task pane, do the following: Select the fifth animation effect (change fill color effect for the second oval). Under Modify: Change Fill Color, do the following: On the slide, select the second text box. In the Custom Animation task pane, do the following: Select the sixth animation effect (fade effect for the second text box). Under Modify: Fade, do the following: Click Add Effect, point to Entrance and then click More Effects. In the Add Entrance Effect dialog box, under Subtle, click Fade. On the slide, select the third oval. In the Custom Animation task pane, do the following: Select the seventh animation effect (change fill color effect for the third oval). Under Modify: Change Fill Color, do the following: On the slide, select the third text box. In the Custom Animation task pane, do the following: Select the eighth animation effect (fade effect for the third text box). Under Modify: Fade, do the following: On the slide, select the fourth oval. In the Custom Animation task pane, do the following: Select the ninth animation effect (change fill color effect for the fourth oval). Under Modify: Change Fill Color, do the following: On the slide, select the fourth text box. In the Custom Animation task pane, do the following: Select the 10th animation effect (fade effect for the fourth text box). Under Modify: Fade, do the following: O coeficiente 0,37p/ hab ou 33 casos em menores de 15 anos. Médio
 Detecção de Casos Novos em Menores de 15 anos. Importância:Expressa a transmissão recente e os focos ativos da doença. Meta:Reduzir em 26,9% até 2015 (a contar de 2008). Custom animation effects: object spins on end. (Advanced) To reproduce the background effects on this slide, do the following: Right-click the slide background area, and then click Format Background. In the Format Background dialog box, click Fill in the left pane, and then select Solid fill in the Fill pane. Click the button next to Color, and then under Theme Colors click White, Background 1 (first row, first option from the left). On the Home tab, in the Slides group, click Layout, and then click Blank. To reproduce the rectangle on this slide, do the following: With the rounded rectangle still selected, under Drawing Tools, on the Format tab, in the Size group, do the following: Select the rectangle. Drag the yellow diamond adjustment handle to the left to decrease the amount of rounding on the corners. On the Home tab, in the Drawing group, click Shapes, and then under Rectangles click Rounded Rectangle (second option from the left). On the slide, drag to draw a rounded rectangle. In the Shape Height box, enter Under Drawing Tools, on the Format tab, in the bottom right corner of the Shape Styles group, click the Format Shape dialog box launcher. In the Format Shape dialog box, click Fill in the left pane. In the Fill pane, select Solid fill, click the button next to Color, and then under Theme Colors click White, Background 1, Darker 15% (third row, first option from the left). In the Shape Width box, enter Also in the Format Shape dialog box, click Shadow in the left pane. In the Shadow pane, click the button next to Presets, under Outer select Offset Bottom (first row, second option from the left), and then do the following: Also in the Format Shape dialog box, click Line Color in the left pane. In the Line Color pane, select No line. In the Blur box, enter 8.5 pt. In the Size box, enter 100%. In the Transparency box, enter 0%. Also in the Format Shape dialog box, click 3-D Format in the left pane. In the 3-D Format pane, do the following: In the Distance box, enter 1 pt. In the Angle box, enter 90°. Under Surface, click the button next to Material, and then under Standard click Matte (first row, first option from the left). Click the button next to Lighting, and then under Neutral click Soft (first row, third option from the left). Under Bevel, click the button next to Top, and then under Bevel click Circle (first row, first option from the left). Next to Top, in the Width box, enter 5 pt, and in the Height box, enter 5 pt. Select the duplicate rectangle. On the Home tab, in the Drawing group, do the following: On the slide, select the rounded rectangle. On the Home tab, in the Clipboard group, click the arrow under Paste, and then click Duplicate. Click the arrow next to Shape Fill, and then click No Fill. Press and hold CTRL, and then select both rectangles. On the Home tab, in the Drawing group, click Arrange, and do the following: Drag the second rectangle above the first rectangle until the lower edge overlays the top edge of the first rectangle. (Note: When the spinning animation effect is created later for these rectangles, the spin will center where the edges of the rectangles meet.) Click the arrow next to Shape Outline, and then click No Outline. Point to Align, and then click Align Center. Point to Align, and then click Align Selected Objects. On the Home tab, in the Drawing group, click Arrange, point to Align, and then do the following: On the slide, drag the group until it is centered horizontally on the left edge of the slide (straddling the edge). Click Group. Click Align Middle. Click Align to Slide. To reproduce the dashed arc on this slide, do the following: On the Home tab, in the Drawing group, click Shapes, and then under Basic Shapes click Arc (third row, 12th option from the left). On the slide, drag to draw an arc. Select the arc. Under Drawing Tools, on the Format tab, in the Size group, do the following: With the arc still selected, on the Home tab, in the Drawing group, click the arrow next to Shape Outline, and then do the following: In the Shape Width box, enter In the Shape Height box, enter Under Theme Colors, click White, Background 1, Darker 15% (third row, first option from the left). Drag the arc until the yellow diamond adjustment handles are on the left edge of the slide. On the slide, drag the yellow diamond adjustment handle on the right side of the arc to the bottom of the arc to create a half circle. Point to Dashes, and then click Dash (fourth option from the top). With the arc still selected, on the Home tab, in the Drawing group, click Arrange, point to Align, and then do the following: To reproduce the half circle on this slide, do the following: Select the duplicate arc. Under Drawing Tools, on the Format tab, in the Size group, do the following: On the slide, select the arc. On the Home tab, in the Clipboard group, click the arrow under Paste, and then click Duplicate. In the Shape Height box, enter Under Drawing Tools, on the Format tab, in the Shape Styles group, click the arrow next to Shape Outline, and then click No Outline. With the second arc still selected, under Drawing Tools, on the Format tab, in the Shape Styles group, click the arrow next to Shape Fill, and then under Theme Colors click White, Background 1, Darker 5% (second row, first option from the left). In the Shape Width box, enter Under Drawing Tools, on the Format tab, in the Shape Styles group, click Shape Effects, point to Shadow, and then click Shadow Options. In the Format Shape dialog box, click Shadow in the left pane. In the Shadow pane, click the button next to Presets, under Inner click Inside Right (second row, third option from the left), and then do the following: In the Angle box, enter 315°. In the Blur box, enter 24 pt. In the Transparency box, enter 86%. On the slide, drag the second arc until the yellow diamond adjustment handles are on the left edge of the slide. On the Home tab, in the Drawing group, click Arrange, and then do the following: In the Distance box, enter 4 pt. Point to Align, and then click Align Middle. Point to Align, and then click Align to Slide. Click Send to Back. To reproduce the button shapes on this slide, do the following: Select the oval. Under Drawing Tools, on the Format tab, in the Size group, do the following: On the Home tab, in the Drawing group, click Shapes, and then under Basic Shapes click Oval (first row, second option from the left). On the slide, drag to draw an oval. In the Shape Height box, enter Under Drawing Tools, on the Format tab, in the bottom right corner of the Shape Styles group, click the Format Shape dialog box launcher. In the Format Shape dialog box, click Fill in the left pane. In the Fill pane, select Solid Fill. Click the button next to Color, and then under Theme Colors click Olive Green, Accent 3, Lighter 80° (second row, seventh option from the left). Under Drawing Tools, on the Format tab, in the Shape Styles group, click More, and then click Light 1 Outline, Colored Fill – Dark 1 (third row, first option from the left). In the Shape Width box, enter Also in the Format Shape dialog box, click Shadow in the left pane. In the Shadow pane, click the button next to Presets, under Outer click Offset Bottom (first row, second option from the left), and then do the following: Also in the Format Shape dialog box, click 3-D Format in the left pane, and then do the following in the 3-D Format pane: Under Contour, click the button next to Color, and then under Theme Colors click White, Background 1 (first row, first option from the left). In the Size box, enter 3.5 pt. Under Bevel, click the button next to Top, and then under Bevel click Art Deco (third row, fourth option from the left). Next to Top, in the Width box, enter 5 pt, and in the Height box, enter 5 pt. On the slide, select the oval. Under Drawing Tools, on the Format tab, in the bottom right corner of the Size group, click the Size and Position dialog box launcher. In the Size and Position dialog box, on the Position tab, do the following: Select the oval. On the Home tab, in the Clipboard group, click the arrow under Paste, and then click Duplicate. In the Vertical box, enter In the Horizontal box, enter Select the duplicate oval. Under Drawing Tools, on the Format tab, in the bottom right corner of the Size group, click the Size and Position dialog box launcher. In the Size and Position dialog box, on the Position tab, do the following: In the Horizontal box, enter Repeat step 9 two more times, for a total of four ovals. Under Drawing Tools, on the Format tab, in the bottom right corner of the Size group, click the Size and Position dialog box launcher. In the Size and Position dialog box, on the Position tab, do the following to position the third and fourth ovals: In the Vertical box, enter Select the fourth oval on the slide, and then enter 2.99 in the Horizontal box and 5.66 in the Vertical box. Select the third oval on the slide, and then enter 3.52 in the Horizontal box and 4.27 in the Vertical box. To reproduce the text on this slide, do the following: On the Insert tab, in the Text group, click Text Box, and then on the slide, drag to draw the text box. Enter text in the text box and select the text. On the Home tab, in the Font group, do the following: In the Font list, select Corbel. On the Home tab, in the Paragraph group, click Align Text Left to align the text left in the text box. Click the arrow next to Font Color, and then under Theme Colors click White, Background 1, Darker 50% (sixth row, first option from the left). In the Font Size list, select 22. On the slide, drag the text box to the right of the first oval. Drag the second text box to the right of the second oval. Click in the text box and edit the text. Select the text box. On the Home tab, in the Clipboard group, click the arrow under Paste, and then click Duplicate. Repeat steps 5-7 to create the third and fourth text boxes, dragging them to the right of the third and fourth ovals. To reproduce the animation effects on this slide, do the following: On the Home tab, in the Editing group, click Select, and then click Selection Pane. On the Animations tab, in the Animations group, click Custom Animation. In the Selection and Visibility pane, select the rectangle group. In the Custom Animation task pane, do the following: Select the animation effect (spin effect for the rectangle group). Under Modify: Spin, do the following: Click Add Effect, point to Emphasis, and then click More Effects. In the Add Emphasis Effect dialog box, under Basic, click Spin. In the Amount list, in the Custom box, enter 123°, and then press ENTER. Also in the Amount list, click Counterclockwise. In the Start list, select With Previous. On the slide, select the first oval. In the Custom Animation task pane, do the following: In the Speed list, select Fast. Select the second animation effect (change fill color effect for the first oval). Under Modify: Change Fill Color, do the following: Click Add Effect, point to Emphasis, and then click More Effects. In the Add Emphasis Effect dialog box, under Basic, click Change Fill Color. In the Start list, select After Previous. On the slide, select the first text box. In the Custom Animation task pane, do the following: In the Speed list, select Very Fast. In the Fill Color list, click More Colors. In the Colors dialog box, on the Custom tab, enter values for Red: 130, Green: 153, Blue: 117. Select the third animation effect (fade effect for the first text box). Under Modify: Fade, do the following: Click Add Effect, point to Entrance, and then click More Effects. In the Add Entrance Effect dialog box, under Subtle, click Fade. Select the fourth animation effect (spin effect for the rectangle group). Under Modify: Spin, do the following: In the Start list, select On Click. In the Amount list, in the Custom box, enter 22°, and then press ENTER. Also in the Amount list, click Clockwise. On the slide, select the second oval. In the Custom Animation task pane, do the following: Select the fifth animation effect (change fill color effect for the second oval). Under Modify: Change Fill Color, do the following: On the slide, select the second text box. In the Custom Animation task pane, do the following: Select the sixth animation effect (fade effect for the second text box). Under Modify: Fade, do the following: Click Add Effect, point to Entrance and then click More Effects. In the Add Entrance Effect dialog box, under Subtle, click Fade. On the slide, select the third oval. In the Custom Animation task pane, do the following: Select the seventh animation effect (change fill color effect for the third oval). Under Modify: Change Fill Color, do the following: On the slide, select the third text box. In the Custom Animation task pane, do the following: Select the eighth animation effect (fade effect for the third text box). Under Modify: Fade, do the following: On the slide, select the fourth oval. In the Custom Animation task pane, do the following: Select the ninth animation effect (change fill color effect for the fourth oval). Under Modify: Change Fill Color, do the following: On the slide, select the fourth text box. In the Custom Animation task pane, do the following: Select the 10th animation effect (fade effect for the fourth text box). Under Modify: Fade, do the following: O coeficiente 0,37p/ hab ou 33 casos em menores de 15 anos. Médio.")
31
53,75%

33
Municípios que detectaram menores de 15 anos, Estado de São Paulo, 2014
GVE GVE\MUN Residência Nº Crianças Coef.Menor de 15 Capital São Paulo 6 0,25 Santo André São Bernardo do Campo 1 0,62 Osasco Carapicuíba 1,1 Itapecerica da Serra 2,5 Araçatuba Ilha Solteira 21,37 Barretos Olímpia 10,04 Bauru Lins 7,11 Lucianópolis 193,42 Campinas Campinas 0,47 Hortolândia 2,14 Indaiatuba 2,26 Marília Gália 74,4 Piracicaba Pirassununga 2 14,09 Presidente Prudente Pirapozinho 18,8 Santo Anastácio 24,59 Ribeirão Preto Ribeirão Preto 4 3,33 Santos Santos 1,42 Caraguatatuba Ubatuba 5,09 Jales Fernandópolis 17,09 Sorocaba Sorocaba 3,16 Total Geral 20Municípios 33 0,37

34
Inserção: PPA – Plano Plurianual; Pacto pela Vida- Pacto de Gestão
Alta por Cura Importância:Avalia a qualidade da atenção e do acompanhamento dos casos diagnosticados até a completitude do tratamento. Meta 2014: 91% Custom animation effects: object spins on end (Advanced) To reproduce the background effects on this slide, do the following: Right-click the slide background area, and then click Format Background. In the Format Background dialog box, click Fill in the left pane, and then select Solid fill in the Fill pane. Click the button next to Color, and then under Theme Colors click White, Background 1 (first row, first option from the left). On the Home tab, in the Slides group, click Layout, and then click Blank. To reproduce the rectangle on this slide, do the following: With the rounded rectangle still selected, under Drawing Tools, on the Format tab, in the Size group, do the following: Select the rectangle. Drag the yellow diamond adjustment handle to the left to decrease the amount of rounding on the corners. On the Home tab, in the Drawing group, click Shapes, and then under Rectangles click Rounded Rectangle (second option from the left). On the slide, drag to draw a rounded rectangle. In the Shape Height box, enter 3.5”. Under Drawing Tools, on the Format tab, in the bottom right corner of the Shape Styles group, click the Format Shape dialog box launcher. In the Format Shape dialog box, click Fill in the left pane. In the Fill pane, select Solid fill, click the button next to Color, and then under Theme Colors click White, Background 1, Darker 15% (third row, first option from the left). In the Shape Width box, enter 0.25”. Also in the Format Shape dialog box, click Shadow in the left pane. In the Shadow pane, click the button next to Presets, under Outer select Offset Bottom (first row, second option from the left), and then do the following: Also in the Format Shape dialog box, click Line Color in the left pane. In the Line Color pane, select No line. In the Blur box, enter 8.5 pt. In the Size box, enter 100%. In the Transparency box, enter 0%. Also in the Format Shape dialog box, click 3-D Format in the left pane. In the 3-D Format pane, do the following: In the Distance box, enter 1 pt. In the Angle box, enter 90°. Under Surface, click the button next to Material, and then under Standard click Matte (first row, first option from the left). Click the button next to Lighting, and then under Neutral click Soft (first row, third option from the left). Under Bevel, click the button next to Top, and then under Bevel click Circle (first row, first option from the left). Next to Top, in the Width box, enter 5 pt, and in the Height box, enter 5 pt. Select the duplicate rectangle. On the Home tab, in the Drawing group, do the following: On the slide, select the rounded rectangle. On the Home tab, in the Clipboard group, click the arrow under Paste, and then click Duplicate. Click the arrow next to Shape Fill, and then click No Fill. Press and hold CTRL, and then select both rectangles. On the Home tab, in the Drawing group, click Arrange, and do the following: Drag the second rectangle above the first rectangle until the lower edge overlays the top edge of the first rectangle. (Note: When the spinning animation effect is created later for these rectangles, the spin will center where the edges of the rectangles meet.) Click the arrow next to Shape Outline, and then click No Outline. Point to Align, and then click Align Center. Point to Align, and then click Align Selected Objects. On the Home tab, in the Drawing group, click Arrange, point to Align, and then do the following: On the slide, drag the group until it is centered horizontally on the left edge of the slide (straddling the edge). Click Group. Click Align Middle. Click Align to Slide. To reproduce the dashed arc on this slide, do the following: On the Home tab, in the Drawing group, click Shapes, and then under Basic Shapes click Arc (third row, 12th option from the left). On the slide, drag to draw an arc. Select the arc. Under Drawing Tools, on the Format tab, in the Size group, do the following: With the arc still selected, on the Home tab, in the Drawing group, click the arrow next to Shape Outline, and then do the following: In the Shape Width box, enter 7.5”. In the Shape Height box, enter 7.5”. Under Theme Colors, click White, Background 1, Darker 15% (third row, first option from the left). Drag the arc until the yellow diamond adjustment handles are on the left edge of the slide. On the slide, drag the yellow diamond adjustment handle on the right side of the arc to the bottom of the arc to create a half circle. Point to Dashes, and then click Dash (fourth option from the top). With the arc still selected, on the Home tab, in the Drawing group, click Arrange, point to Align, and then do the following: To reproduce the half circle on this slide, do the following: Select the duplicate arc. Under Drawing Tools, on the Format tab, in the Size group, do the following: On the slide, select the arc. On the Home tab, in the Clipboard group, click the arrow under Paste, and then click Duplicate. In the Shape Height box, enter 3.33”. Under Drawing Tools, on the Format tab, in the Shape Styles group, click the arrow next to Shape Outline, and then click No Outline. With the second arc still selected, under Drawing Tools, on the Format tab, in the Shape Styles group, click the arrow next to Shape Fill, and then under Theme Colors click White, Background 1, Darker 5% (second row, first option from the left). In the Shape Width box, enter 3.33”. Under Drawing Tools, on the Format tab, in the Shape Styles group, click Shape Effects, point to Shadow, and then click Shadow Options. In the Format Shape dialog box, click Shadow in the left pane. In the Shadow pane, click the button next to Presets, under Inner click Inside Right (second row, third option from the left), and then do the following: In the Angle box, enter 315°. In the Blur box, enter 24 pt. In the Transparency box, enter 86%. On the slide, drag the second arc until the yellow diamond adjustment handles are on the left edge of the slide. On the Home tab, in the Drawing group, click Arrange, and then do the following: In the Distance box, enter 4 pt. Point to Align, and then click Align Middle. Point to Align, and then click Align to Slide. Click Send to Back. To reproduce the button shapes on this slide, do the following: Select the oval. Under Drawing Tools, on the Format tab, in the Size group, do the following: On the Home tab, in the Drawing group, click Shapes, and then under Basic Shapes click Oval (first row, second option from the left). On the slide, drag to draw an oval. In the Shape Height box, enter 0.34”. Under Drawing Tools, on the Format tab, in the bottom right corner of the Shape Styles group, click the Format Shape dialog box launcher. In the Format Shape dialog box, click Fill in the left pane. In the Fill pane, select Solid Fill. Click the button next to Color, and then under Theme Colors click Olive Green, Accent 3, Lighter 80° (second row, seventh option from the left). Under Drawing Tools, on the Format tab, in the Shape Styles group, click More, and then click Light 1 Outline, Colored Fill – Dark 1 (third row, first option from the left). In the Shape Width box, enter 0.34”. Also in the Format Shape dialog box, click Shadow in the left pane. In the Shadow pane, click the button next to Presets, under Outer click Offset Bottom (first row, second option from the left), and then do the following: Also in the Format Shape dialog box, click 3-D Format in the left pane, and then do the following in the 3-D Format pane: Under Contour, click the button next to Color, and then under Theme Colors click White, Background 1 (first row, first option from the left). In the Size box, enter 3.5 pt. Under Bevel, click the button next to Top, and then under Bevel click Art Deco (third row, fourth option from the left). Next to Top, in the Width box, enter 5 pt, and in the Height box, enter 5 pt. On the slide, select the oval. Under Drawing Tools, on the Format tab, in the bottom right corner of the Size group, click the Size and Position dialog box launcher. In the Size and Position dialog box, on the Position tab, do the following: Select the oval. On the Home tab, in the Clipboard group, click the arrow under Paste, and then click Duplicate. In the Vertical box, enter 1.5”. In the Horizontal box, enter 2.98”. Select the duplicate oval. Under Drawing Tools, on the Format tab, in the bottom right corner of the Size group, click the Size and Position dialog box launcher. In the Size and Position dialog box, on the Position tab, do the following: In the Horizontal box, enter 3.52”. Repeat step 9 two more times, for a total of four ovals. Under Drawing Tools, on the Format tab, in the bottom right corner of the Size group, click the Size and Position dialog box launcher. In the Size and Position dialog box, on the Position tab, do the following to position the third and fourth ovals: In the Vertical box, enter 2.98”. Select the fourth oval on the slide, and then enter 2.99” in the Horizontal box and 5.66” in the Vertical box. Select the third oval on the slide, and then enter 3.52” in the Horizontal box and 4.27” in the Vertical box. To reproduce the text on this slide, do the following: On the Insert tab, in the Text group, click Text Box, and then on the slide, drag to draw the text box. Enter text in the text box and select the text. On the Home tab, in the Font group, do the following: In the Font list, select Corbel. On the Home tab, in the Paragraph group, click Align Text Left to align the text left in the text box. Click the arrow next to Font Color, and then under Theme Colors click White, Background 1, Darker 50% (sixth row, first option from the left). In the Font Size list, select 22. On the slide, drag the text box to the right of the first oval. Drag the second text box to the right of the second oval. Click in the text box and edit the text. Select the text box. On the Home tab, in the Clipboard group, click the arrow under Paste, and then click Duplicate. Repeat steps 5-7 to create the third and fourth text boxes, dragging them to the right of the third and fourth ovals. To reproduce the animation effects on this slide, do the following: On the Home tab, in the Editing group, click Select, and then click Selection Pane. On the Animations tab, in the Animations group, click Custom Animation. In the Selection and Visibility pane, select the rectangle group. In the Custom Animation task pane, do the following: Select the animation effect (spin effect for the rectangle group). Under Modify: Spin, do the following: Click Add Effect, point to Emphasis, and then click More Effects. In the Add Emphasis Effect dialog box, under Basic, click Spin. In the Amount list, in the Custom box, enter 123°, and then press ENTER. Also in the Amount list, click Counterclockwise. In the Start list, select With Previous. On the slide, select the first oval. In the Custom Animation task pane, do the following: In the Speed list, select Fast. Select the second animation effect (change fill color effect for the first oval). Under Modify: Change Fill Color, do the following: Click Add Effect, point to Emphasis, and then click More Effects. In the Add Emphasis Effect dialog box, under Basic, click Change Fill Color. In the Start list, select After Previous. On the slide, select the first text box. In the Custom Animation task pane, do the following: In the Speed list, select Very Fast. In the Fill Color list, click More Colors. In the Colors dialog box, on the Custom tab, enter values for Red: 130, Green: 153, Blue: 117. Select the third animation effect (fade effect for the first text box). Under Modify: Fade, do the following: Click Add Effect, point to Entrance, and then click More Effects. In the Add Entrance Effect dialog box, under Subtle, click Fade. Select the fourth animation effect (spin effect for the rectangle group). Under Modify: Spin, do the following: In the Start list, select On Click. In the Amount list, in the Custom box, enter 22°, and then press ENTER. Also in the Amount list, click Clockwise. On the slide, select the second oval. In the Custom Animation task pane, do the following: Select the fifth animation effect (change fill color effect for the second oval). Under Modify: Change Fill Color, do the following: On the slide, select the second text box. In the Custom Animation task pane, do the following: Select the sixth animation effect (fade effect for the second text box). Under Modify: Fade, do the following: Click Add Effect, point to Entrance and then click More Effects. In the Add Entrance Effect dialog box, under Subtle, click Fade. On the slide, select the third oval. In the Custom Animation task pane, do the following: Select the seventh animation effect (change fill color effect for the third oval). Under Modify: Change Fill Color, do the following: On the slide, select the third text box. In the Custom Animation task pane, do the following: Select the eighth animation effect (fade effect for the third text box). Under Modify: Fade, do the following: On the slide, select the fourth oval. In the Custom Animation task pane, do the following: Select the ninth animation effect (change fill color effect for the fourth oval). Under Modify: Change Fill Color, do the following: On the slide, select the fourth text box. In the Custom Animation task pane, do the following: Select the 10th animation effect (fade effect for the fourth text box). Under Modify: Fade, do the following: Alcançado: 91,92%
 To reproduce the background effects on this slide, do the following: Right-click the slide background area, and then click Format Background. In the Format Background dialog box, click Fill in the left pane, and then select Solid fill in the Fill pane. Click the button next to Color, and then under Theme Colors click White, Background 1 (first row, first option from the left). On the Home tab, in the Slides group, click Layout, and then click Blank. To reproduce the rectangle on this slide, do the following: With the rounded rectangle still selected, under Drawing Tools, on the Format tab, in the Size group, do the following: Select the rectangle. Drag the yellow diamond adjustment handle to the left to decrease the amount of rounding on the corners. On the Home tab, in the Drawing group, click Shapes, and then under Rectangles click Rounded Rectangle (second option from the left). On the slide, drag to draw a rounded rectangle. In the Shape Height box, enter Under Drawing Tools, on the Format tab, in the bottom right corner of the Shape Styles group, click the Format Shape dialog box launcher. In the Format Shape dialog box, click Fill in the left pane. In the Fill pane, select Solid fill, click the button next to Color, and then under Theme Colors click White, Background 1, Darker 15% (third row, first option from the left). In the Shape Width box, enter Also in the Format Shape dialog box, click Shadow in the left pane. In the Shadow pane, click the button next to Presets, under Outer select Offset Bottom (first row, second option from the left), and then do the following: Also in the Format Shape dialog box, click Line Color in the left pane. In the Line Color pane, select No line. In the Blur box, enter 8.5 pt. In the Size box, enter 100%. In the Transparency box, enter 0%. Also in the Format Shape dialog box, click 3-D Format in the left pane. In the 3-D Format pane, do the following: In the Distance box, enter 1 pt. In the Angle box, enter 90°. Under Surface, click the button next to Material, and then under Standard click Matte (first row, first option from the left). Click the button next to Lighting, and then under Neutral click Soft (first row, third option from the left). Under Bevel, click the button next to Top, and then under Bevel click Circle (first row, first option from the left). Next to Top, in the Width box, enter 5 pt, and in the Height box, enter 5 pt. Select the duplicate rectangle. On the Home tab, in the Drawing group, do the following: On the slide, select the rounded rectangle. On the Home tab, in the Clipboard group, click the arrow under Paste, and then click Duplicate. Click the arrow next to Shape Fill, and then click No Fill. Press and hold CTRL, and then select both rectangles. On the Home tab, in the Drawing group, click Arrange, and do the following: Drag the second rectangle above the first rectangle until the lower edge overlays the top edge of the first rectangle. (Note: When the spinning animation effect is created later for these rectangles, the spin will center where the edges of the rectangles meet.) Click the arrow next to Shape Outline, and then click No Outline. Point to Align, and then click Align Center. Point to Align, and then click Align Selected Objects. On the Home tab, in the Drawing group, click Arrange, point to Align, and then do the following: On the slide, drag the group until it is centered horizontally on the left edge of the slide (straddling the edge). Click Group. Click Align Middle. Click Align to Slide. To reproduce the dashed arc on this slide, do the following: On the Home tab, in the Drawing group, click Shapes, and then under Basic Shapes click Arc (third row, 12th option from the left). On the slide, drag to draw an arc. Select the arc. Under Drawing Tools, on the Format tab, in the Size group, do the following: With the arc still selected, on the Home tab, in the Drawing group, click the arrow next to Shape Outline, and then do the following: In the Shape Width box, enter In the Shape Height box, enter Under Theme Colors, click White, Background 1, Darker 15% (third row, first option from the left). Drag the arc until the yellow diamond adjustment handles are on the left edge of the slide. On the slide, drag the yellow diamond adjustment handle on the right side of the arc to the bottom of the arc to create a half circle. Point to Dashes, and then click Dash (fourth option from the top). With the arc still selected, on the Home tab, in the Drawing group, click Arrange, point to Align, and then do the following: To reproduce the half circle on this slide, do the following: Select the duplicate arc. Under Drawing Tools, on the Format tab, in the Size group, do the following: On the slide, select the arc. On the Home tab, in the Clipboard group, click the arrow under Paste, and then click Duplicate. In the Shape Height box, enter Under Drawing Tools, on the Format tab, in the Shape Styles group, click the arrow next to Shape Outline, and then click No Outline. With the second arc still selected, under Drawing Tools, on the Format tab, in the Shape Styles group, click the arrow next to Shape Fill, and then under Theme Colors click White, Background 1, Darker 5% (second row, first option from the left). In the Shape Width box, enter Under Drawing Tools, on the Format tab, in the Shape Styles group, click Shape Effects, point to Shadow, and then click Shadow Options. In the Format Shape dialog box, click Shadow in the left pane. In the Shadow pane, click the button next to Presets, under Inner click Inside Right (second row, third option from the left), and then do the following: In the Angle box, enter 315°. In the Blur box, enter 24 pt. In the Transparency box, enter 86%. On the slide, drag the second arc until the yellow diamond adjustment handles are on the left edge of the slide. On the Home tab, in the Drawing group, click Arrange, and then do the following: In the Distance box, enter 4 pt. Point to Align, and then click Align Middle. Point to Align, and then click Align to Slide. Click Send to Back. To reproduce the button shapes on this slide, do the following: Select the oval. Under Drawing Tools, on the Format tab, in the Size group, do the following: On the Home tab, in the Drawing group, click Shapes, and then under Basic Shapes click Oval (first row, second option from the left). On the slide, drag to draw an oval. In the Shape Height box, enter Under Drawing Tools, on the Format tab, in the bottom right corner of the Shape Styles group, click the Format Shape dialog box launcher. In the Format Shape dialog box, click Fill in the left pane. In the Fill pane, select Solid Fill. Click the button next to Color, and then under Theme Colors click Olive Green, Accent 3, Lighter 80° (second row, seventh option from the left). Under Drawing Tools, on the Format tab, in the Shape Styles group, click More, and then click Light 1 Outline, Colored Fill – Dark 1 (third row, first option from the left). In the Shape Width box, enter Also in the Format Shape dialog box, click Shadow in the left pane. In the Shadow pane, click the button next to Presets, under Outer click Offset Bottom (first row, second option from the left), and then do the following: Also in the Format Shape dialog box, click 3-D Format in the left pane, and then do the following in the 3-D Format pane: Under Contour, click the button next to Color, and then under Theme Colors click White, Background 1 (first row, first option from the left). In the Size box, enter 3.5 pt. Under Bevel, click the button next to Top, and then under Bevel click Art Deco (third row, fourth option from the left). Next to Top, in the Width box, enter 5 pt, and in the Height box, enter 5 pt. On the slide, select the oval. Under Drawing Tools, on the Format tab, in the bottom right corner of the Size group, click the Size and Position dialog box launcher. In the Size and Position dialog box, on the Position tab, do the following: Select the oval. On the Home tab, in the Clipboard group, click the arrow under Paste, and then click Duplicate. In the Vertical box, enter In the Horizontal box, enter Select the duplicate oval. Under Drawing Tools, on the Format tab, in the bottom right corner of the Size group, click the Size and Position dialog box launcher. In the Size and Position dialog box, on the Position tab, do the following: In the Horizontal box, enter Repeat step 9 two more times, for a total of four ovals. Under Drawing Tools, on the Format tab, in the bottom right corner of the Size group, click the Size and Position dialog box launcher. In the Size and Position dialog box, on the Position tab, do the following to position the third and fourth ovals: In the Vertical box, enter Select the fourth oval on the slide, and then enter 2.99 in the Horizontal box and 5.66 in the Vertical box. Select the third oval on the slide, and then enter 3.52 in the Horizontal box and 4.27 in the Vertical box. To reproduce the text on this slide, do the following: On the Insert tab, in the Text group, click Text Box, and then on the slide, drag to draw the text box. Enter text in the text box and select the text. On the Home tab, in the Font group, do the following: In the Font list, select Corbel. On the Home tab, in the Paragraph group, click Align Text Left to align the text left in the text box. Click the arrow next to Font Color, and then under Theme Colors click White, Background 1, Darker 50% (sixth row, first option from the left). In the Font Size list, select 22. On the slide, drag the text box to the right of the first oval. Drag the second text box to the right of the second oval. Click in the text box and edit the text. Select the text box. On the Home tab, in the Clipboard group, click the arrow under Paste, and then click Duplicate. Repeat steps 5-7 to create the third and fourth text boxes, dragging them to the right of the third and fourth ovals. To reproduce the animation effects on this slide, do the following: On the Home tab, in the Editing group, click Select, and then click Selection Pane. On the Animations tab, in the Animations group, click Custom Animation. In the Selection and Visibility pane, select the rectangle group. In the Custom Animation task pane, do the following: Select the animation effect (spin effect for the rectangle group). Under Modify: Spin, do the following: Click Add Effect, point to Emphasis, and then click More Effects. In the Add Emphasis Effect dialog box, under Basic, click Spin. In the Amount list, in the Custom box, enter 123°, and then press ENTER. Also in the Amount list, click Counterclockwise. In the Start list, select With Previous. On the slide, select the first oval. In the Custom Animation task pane, do the following: In the Speed list, select Fast. Select the second animation effect (change fill color effect for the first oval). Under Modify: Change Fill Color, do the following: Click Add Effect, point to Emphasis, and then click More Effects. In the Add Emphasis Effect dialog box, under Basic, click Change Fill Color. In the Start list, select After Previous. On the slide, select the first text box. In the Custom Animation task pane, do the following: In the Speed list, select Very Fast. In the Fill Color list, click More Colors. In the Colors dialog box, on the Custom tab, enter values for Red: 130, Green: 153, Blue: 117. Select the third animation effect (fade effect for the first text box). Under Modify: Fade, do the following: Click Add Effect, point to Entrance, and then click More Effects. In the Add Entrance Effect dialog box, under Subtle, click Fade. Select the fourth animation effect (spin effect for the rectangle group). Under Modify: Spin, do the following: In the Start list, select On Click. In the Amount list, in the Custom box, enter 22°, and then press ENTER. Also in the Amount list, click Clockwise. On the slide, select the second oval. In the Custom Animation task pane, do the following: Select the fifth animation effect (change fill color effect for the second oval). Under Modify: Change Fill Color, do the following: On the slide, select the second text box. In the Custom Animation task pane, do the following: Select the sixth animation effect (fade effect for the second text box). Under Modify: Fade, do the following: Click Add Effect, point to Entrance and then click More Effects. In the Add Entrance Effect dialog box, under Subtle, click Fade. On the slide, select the third oval. In the Custom Animation task pane, do the following: Select the seventh animation effect (change fill color effect for the third oval). Under Modify: Change Fill Color, do the following: On the slide, select the third text box. In the Custom Animation task pane, do the following: Select the eighth animation effect (fade effect for the third text box). Under Modify: Fade, do the following: On the slide, select the fourth oval. In the Custom Animation task pane, do the following: Select the ninth animation effect (change fill color effect for the fourth oval). Under Modify: Change Fill Color, do the following: On the slide, select the fourth text box. In the Custom Animation task pane, do the following: Select the 10th animation effect (fade effect for the fourth text box). Under Modify: Fade, do the following: Alcançado: 91,92%")
35
Proporção de Avaliados e Grau de Incapacidades,Estado de São Paulo, 2014.

36
Coeficiente de Grau II de Incapacidades
Coeficiente de Grau II de Incapacidades* no Diagnóstico, Estado de São Paulo, 2014 *(p/ hab.)
")
38
Descrição do Processo de Trabalho 2.Municípios Prioritários
Critérios P1 P2 Menos de hab. 7 ou mais casos nos últimos 3 anos ou 1 ou mais casos em menor de 15 anos1 5 a 6 ou mais casos nos últimos 3 anos e ausência de casos em menor de 15 anos Entre e hab. 10 ou mais casos nos ultimos3 anos ou 1 ou mais casos em menores de 15 anos 7 a 9 ou mais casos nos últimos 3 anos e ausência de casos em menor de 15 anos Entre e 15 ou mais casos nos ultimos3 anos ou 1 ou mais casos em menores de 15 anos 10 a 14 ou mais casos nos últimos 3 anos e ausência de casos em menor de 15 anos Mais de hab. Coeficiente de Detecção maior ou igual a 3,00/ hab. Coeficiente de Detecção maior ou igual a 1,00/hab. e menor do que 3,0/ hab. 2014 Prioridade 2014 2013 2012 2011 Prioridade 1 – P1 109 145 154 151 Prioridade 1 – Criança – P1-Ç 28 26 43 Prioridade 2 48 62 82 87 Total Prioridades 185 233 262 281 Sem Prioridade 460 412 383 362 Total Geral 645

40
Planos e metas Plano Estadual de Saúde 2012 a 1015
Programação Anual de Saúde do Estado de São Paulo a2015 Planos e metas

41
1. Plano Estadual de Saúde 2012 a 2015 1
1. Plano Estadual de Saúde 2012 a – Programação Anual de Saúde do Estado de São Paulo a2015 EIXO III VIGILÂNCIA EM SAÚDE DIRETRIZ III. 1 FORTALECER A VIGILÂNCIA EPIDEMIOLÓGICA E O CONTROLE DAS DOENÇAS E AGRAVOS TRANSMISSÍVEIS E NÃO TRANSMISSÍVEIS. OBJETIVO – III. 1.5 Eliminar a hanseníase em todas as regiões do Estado. META Meta 1 – Atingir 90% de taxa cura nas coortes de pacientes em todos os Grupos de Vigilância Epidemiológicas - GVE Meta 2 – Atingir a meta de menos de 1 caso/ habitantes em todos os GVE INDICADOR Nº de pacientes de hanseníase curados no ano / nº de pacientes de hanseníase diagnosticados no ano X 100. Nº de GVEs com menos de 1 caso/10.000 META Manter (base de 89,45% em 2011) ou aumentar a proporção de cura em 2013 Ampliar em 5% a proporção de exames de contatos (base de 73,2%) ANÁLISE DO ALCANCE DA META 2012. Percentual de alcance e quantitativo correspondente, (físico e financeiro - quando possível). Justificativa se não alcançada à meta programada. Taxa de cura = 91,29% Proporção de exames de contatos = 77,34%
 ou aumentar a proporção de cura em Ampliar em 5% a proporção de exames de contatos (base de 73,2%) ANÁLISE DO ALCANCE DA META Percentual de alcance e quantitativo correspondente, (físico e financeiro - quando possível). Justificativa se não alcançada à meta programada. Taxa de cura = 91,29% Proporção de exames de contatos = 77,34%")
42
1. Plano Estadual de Saúde 2012 a 1015 1
1. Plano Estadual de Saúde 2012 a – Programação Anual de Saúde do Estado de São Paulo a 2015 EIXO III VIGILÂNCIA EM SAÚDE DIRETRIZ III. 1 FORTALECER A VIGILÂNCIA EPIDEMIOLÓGICA E O CONTROLE DAS DOENÇAS E AGRAVOS TRANSMISSÍVEIS E NÃO TRANSMISSÍVEIS. OBJETIVO – III. 1.5 Eliminar a hanseníase em todas as regiões do Estado. META Meta 1 – Atingir 90% de taxa cura nas coortes de pacientes em todos os Grupos de Vigilância Epidemiológicas - GVE Meta 2 – Atingir a meta de menos de 1 caso/ habitantes em todos os GVE INDICADOR Nº de pacientes de hanseníase curados no ano / nº de pacientes de hanseníase diagnosticados no ano X 100. Nº de GVEs com menos de 1 caso/10.000 META Meta 1: Atingir 91, % de taxa de cura nas coortes de pacientes PB e MB. Meta 2: Atingir a meta de menos de 1 caso/ habitantes nas GVEs de Franca, Ribeirão Preto e Registro. Meta 3: Aumentar a proporção de examinados entre os contatos intradomiciliares registrados dos casos novos de hanseníase no ano nos municípios de Presidente Prudente, Severínia, Barretos e Monte Azul Paulista 75% ou mais. ANÁLISE DO ALCANCE DA META 2013. Percentual de alcance e quantitativo correspondente, (físico e financeiro - quando possível). Justificativa se não alcançada à meta programada. Taxa de cura – 91,17% Este dado contém casos transferidos entre municípios que não conseguimos realizar a vinculação. (36 registros) Franca = 0,94 Ribeirão Preto = 0, Registro 0,95 Presidente Prudente = 58,33% Severínia = 100% (23/23) Barretos = 100% (40/40) Monte Azul Pta (= 100% (8/8) Base de Dados – SINAN 09/01/2014
. Justificativa se não alcançada à meta programada. Taxa de cura – 91,17% Este dado contém casos transferidos entre municípios que não conseguimos realizar a vinculação. (36 registros) Franca = 0,94 Ribeirão Preto = 0,95 Registro 0,95. Presidente Prudente = 58,33% Severínia = 100% (23/23) Barretos = 100% (40/40) Monte Azul Pta (= 100% (8/8) Base de Dados – SINAN 09/01/2014.")
43
1. Plano Estadual de Saúde 2012 a 1015 1
1. Plano Estadual de Saúde 2012 a – Programação Anual de Saúde do Estado de São Paulo a2015 EIXO III VIGILÂNCIA EM SAÚDE DIRETRIZ III. 1 FORTALECER A VIGILÂNCIA EPIDEMIOLÓGICA E O CONTROLE DAS DOENÇAS E AGRAVOS TRANSMISSÍVEIS E NÃO TRANSMISSÍVEIS. OBJETIVO – III. 1.5 Eliminar a hanseníase em todas as regiões do Estado. META Meta 1 – Atingir 90% de taxa cura nas coortes de pacientes em todos os Grupos de Vigilância Epidemiológicas - GVE Meta 2 – Atingir a meta de menos de 1 caso/ habitantes em todos os GVE INDICADOR Nº de pacientes de hanseníase curados no ano / nº de pacientes de hanseníase diagnosticados no ano X 100. Nº de GVEs com menos de 1 caso/10.000 META 1. Manter (base de 91,3% em 2012) ou aumentar a proporção de cura em 2014 2. Eliminar a hanseníase como problema de saúde públicas no GVE de Presidente Prudente. 3. Ampliar em 5% a proporção de exames de contatos (base estadual de 77,34% em 2012); - Aumentar em 30% a proporção de exames de contato da GVE de Santos (base Regional 2012 – 28,74%) - Aumentar em 30% a proporção de exames de contato dos municípios da GVE de Taubaté: Pindamonhangaba (base ,11%); Potim (base ,32%) e Taubaté (base ,69%). ANÁLISE DO ALCANCE DA META 2014. Avaliação em 31/12/2014 META ANÁLISE DO ALCANCE DA META 2015. Avaliação em 31/12/2015
 ou aumentar a proporção de cura em Eliminar a hanseníase como problema de saúde públicas no GVE de Presidente Prudente. 3. Ampliar em 5% a proporção de exames de contatos (base estadual de 77,34% em 2012); - Aumentar em 30% a proporção de exames de contato da GVE de Santos (base Regional 2012 – 28,74%) - Aumentar em 30% a proporção de exames de contato dos municípios da GVE de Taubaté: Pindamonhangaba (base ,11%); Potim (base ,32%) e Taubaté (base ,69%). ANÁLISE DO ALCANCE DA META Avaliação em 31/12/2014. META ANÁLISE DO ALCANCE DA META Avaliação em 31/12/2015.")
Apresentações semelhantes
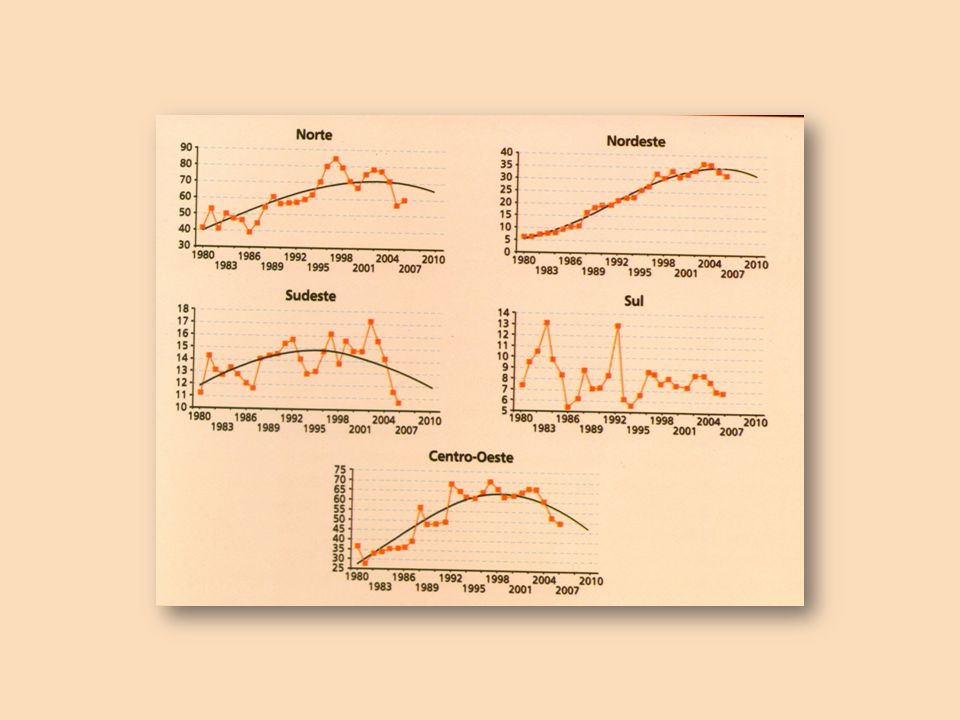
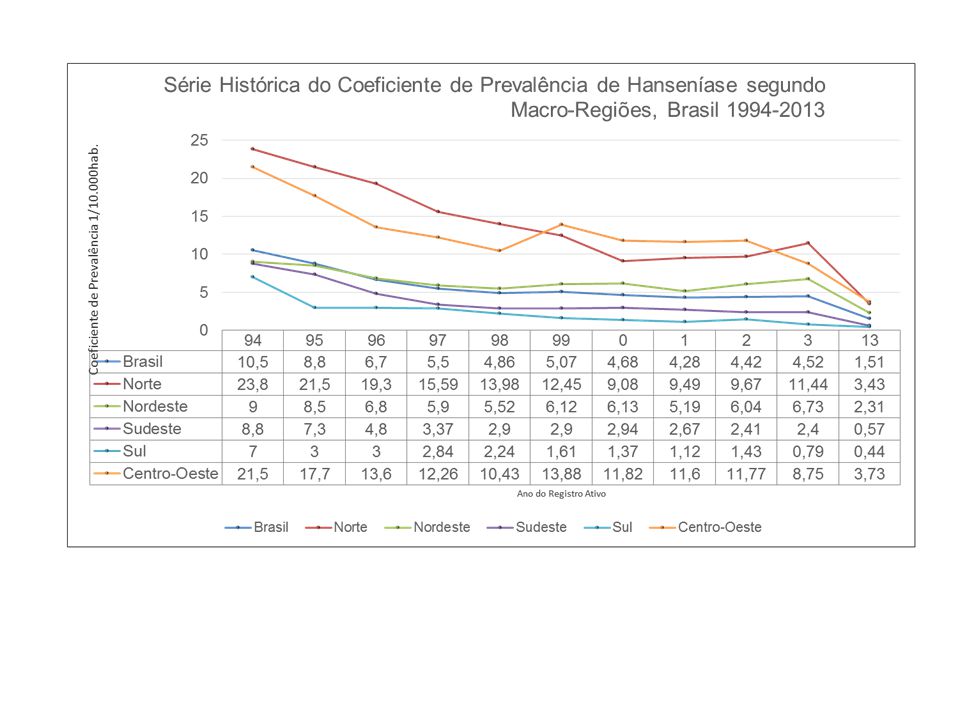
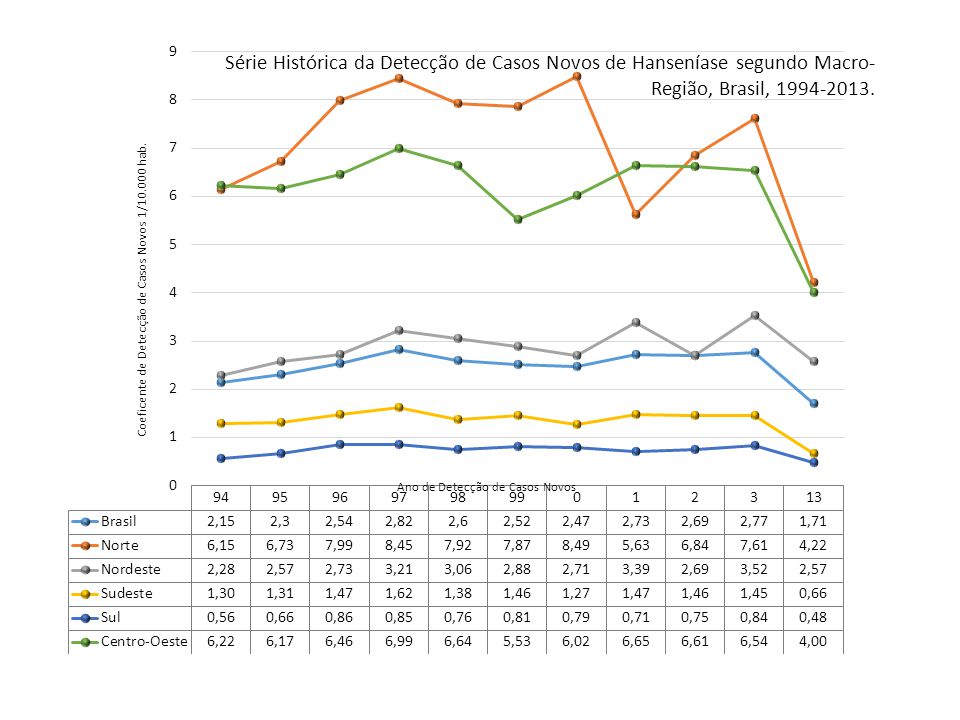
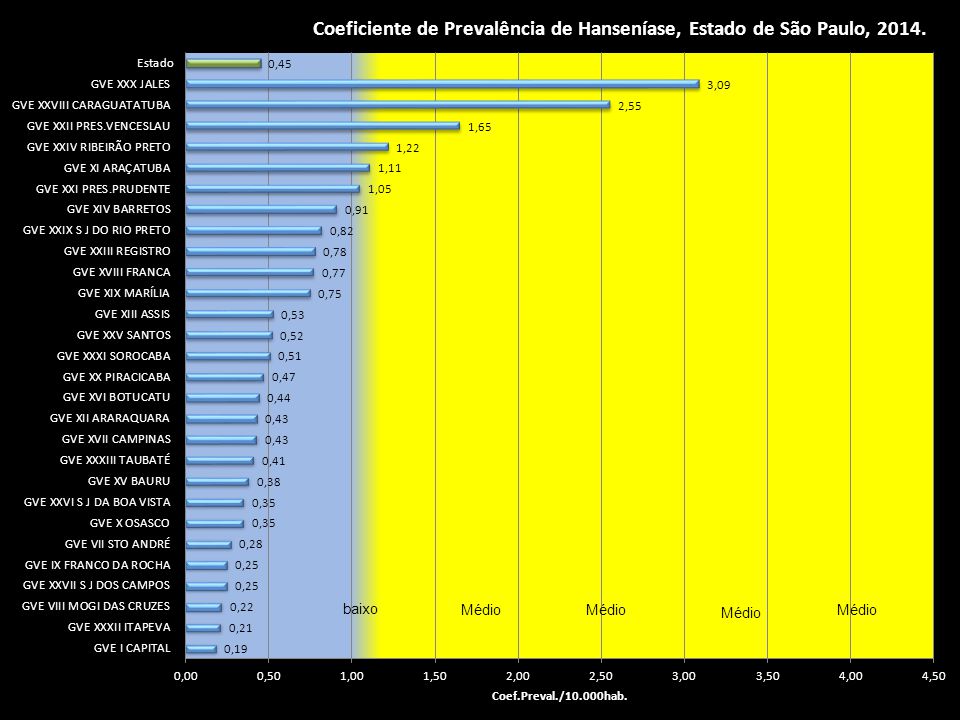
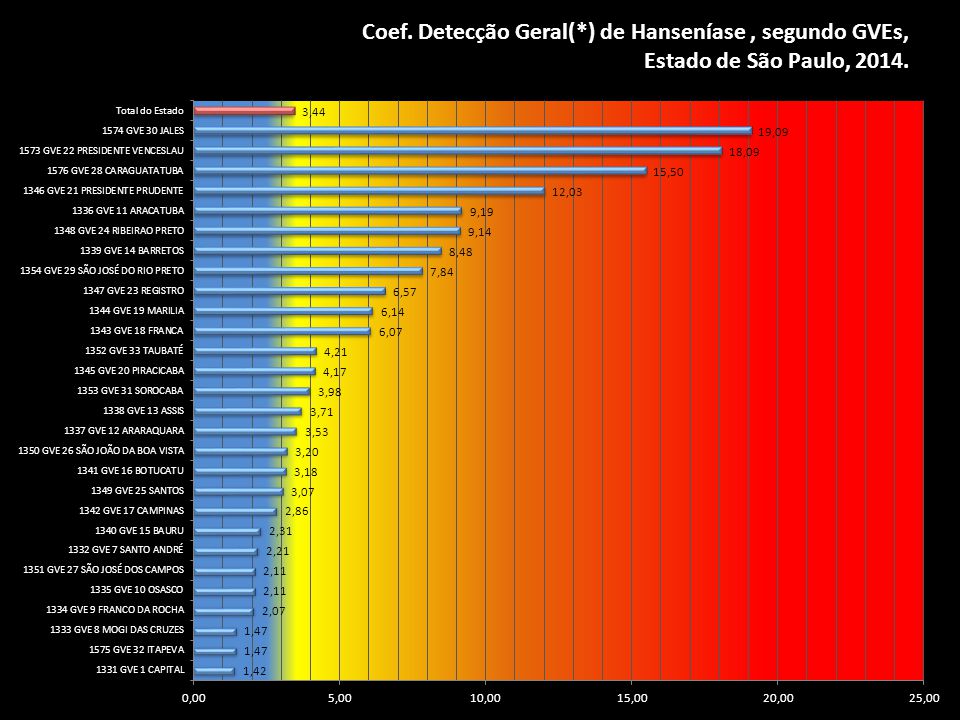
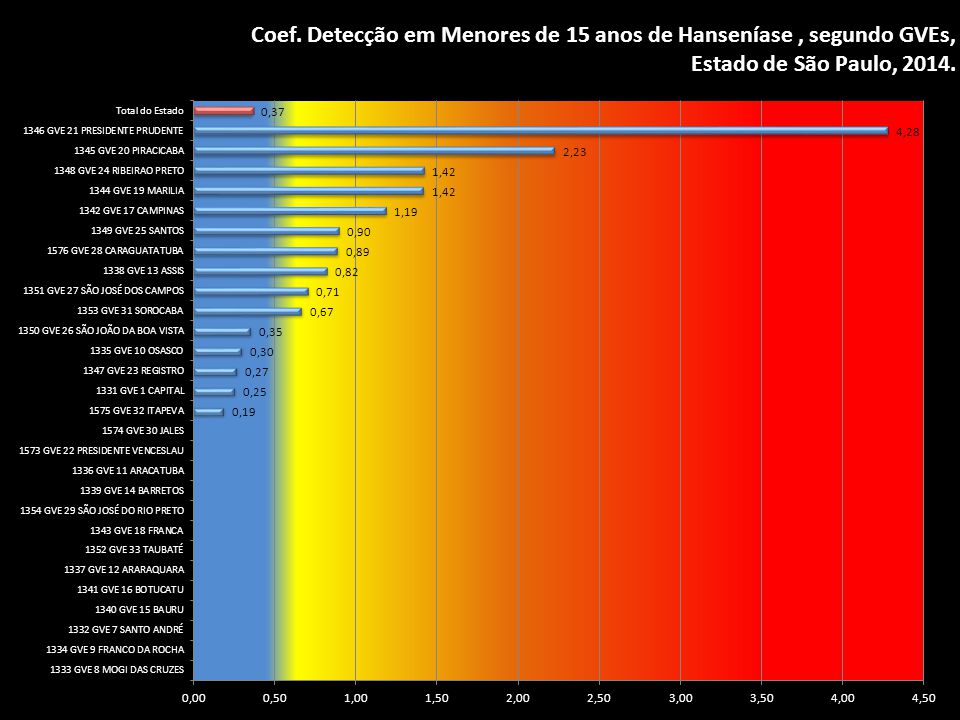
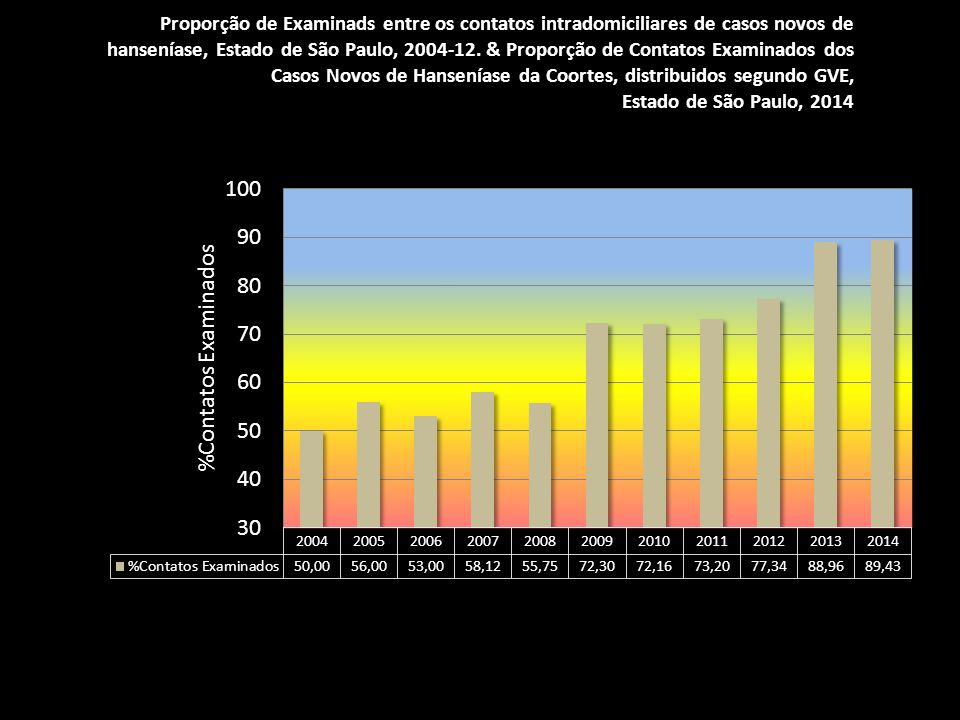


>")


