Carregar apresentação
A apresentação está carregando. Por favor, espere

5
Eurozona Austria Bélgica Chipre Finlândia França Alemanha Grécia Irlanda Itália Luxemburgo Malta Holanda Portugal Eslovénia Espanha Eslováquia Estónia

6
Adesões previstas Lituânia Bulgária República Checa Letónia Polónia Roménia

7
Critérios de convergência de Maastrich para a moeda única

8
Copyright © 2009 Pearson Addison- Wesley. All rights reserved. 20-8 Theory of Optimum Currency Areas The theory of optimum currency areas argues that the optimal area for a system of fixed exchange rates, or a common currency, is one that is highly economically integrated. –economic integration means free flows of goods and services (trade) financial capital (assets) and physical capital workers/labor (immigration and emigration) The theory was developed by Robert Mundell in 1961.
 financial capital (assets) and physical capital workers/labor (immigration and emigration) The theory was developed by Robert Mundell in")
9
União Monetária

10
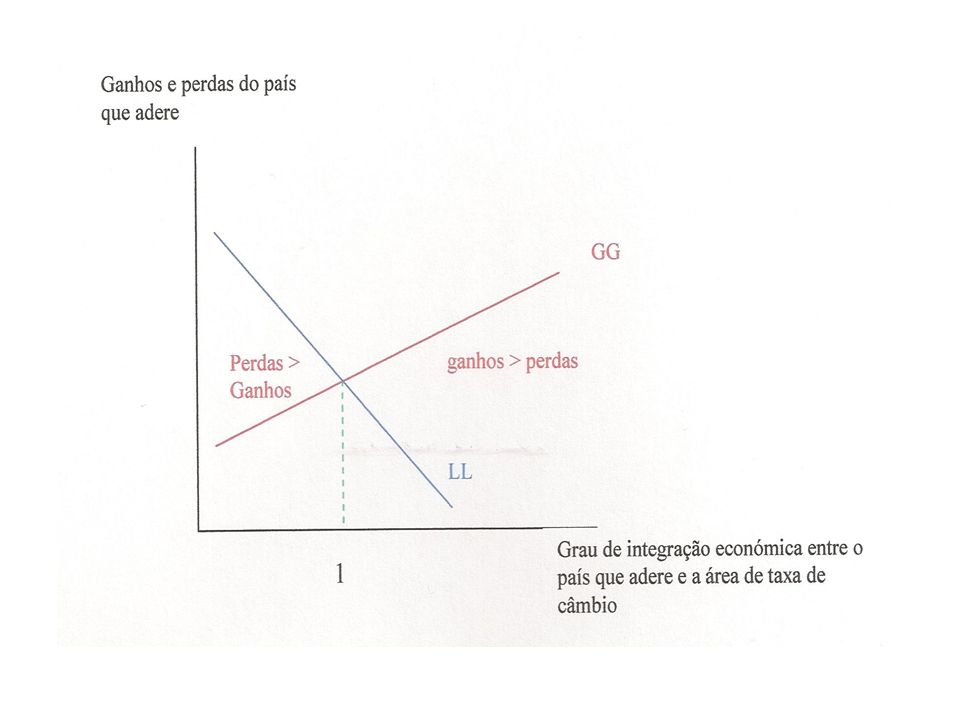
Copyright © 2009 Pearson Addison- Wesley. All rights reserved. 20-10 Fig. 20-3: The GG Schedule

11
Copyright © 2009 Pearson Addison- Wesley. All rights reserved. 20-11 Fig. 20-4: The LL Schedule

15
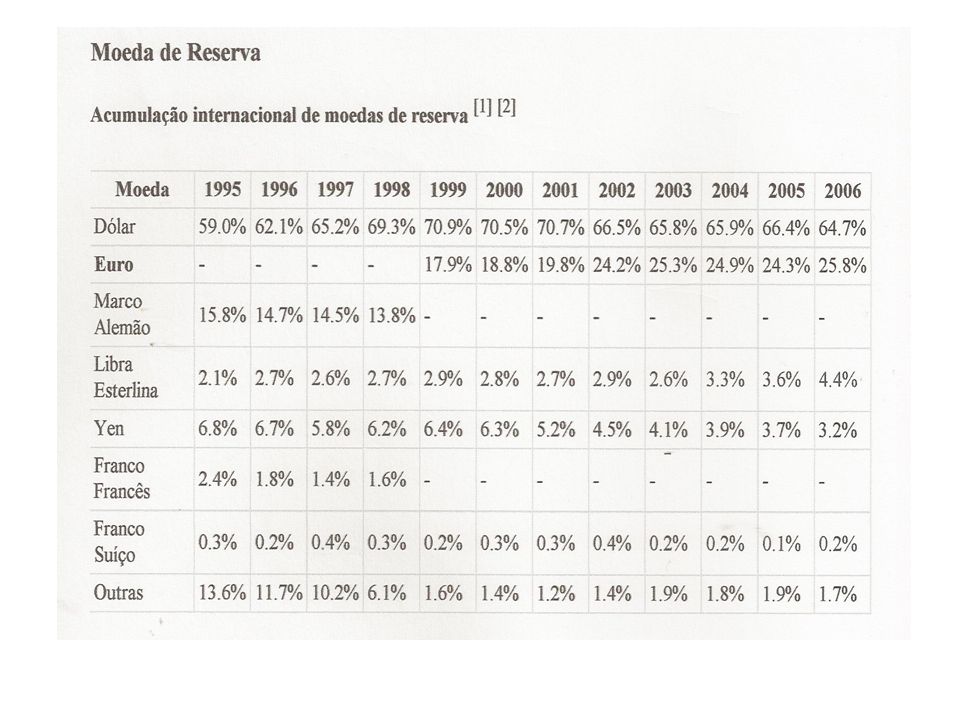
Dólar vs euro como moeda internacional

17
Copyright © 2009 Pearson Addison- Wesley. All rights reserved. 20-17 Is the EU an Optimum Currency Area? If the EU/EMS/economic and monetary union can be expected to benefit members, we expect that its members have a high degree of economic integration: –large trade volumes as a fraction of GDP –a large amount of foreign financial investment and foreign direct investment relative to total investment –a large amount of migration across borders as a fraction of total labor force

18
Intra-EU trade as % of EU GDP

19
Copyright © 2009 Pearson Addison- Wesley. All rights reserved. 20-19 Is the EU an Optimum Currency Area? (cont.) Most EU members export from 10% to 20% of GDP to other EU members –This compares with exports of less than 2% of EU GDP to the US. –But trade between regions in the US is a larger fraction of regional GDP. Was trade restricted by regulations that were removed under the Single European Act?
 Most EU members export from 10% to 20% of GDP to other EU members –This compares with exports of less than 2% of EU GDP to the US. –But trade between regions in the US is a larger fraction of regional GDP. Was trade restricted by regulations that were removed under the Single European Act .")
20
Copyright © 2009 Pearson Addison- Wesley. All rights reserved. 20-20 Fig. 20-7: Intra-EU Trade as a Percent of EU GDP Source: OECD Statistical Yearbook and Eurostat.

21
Copyright © 2009 Pearson Addison- Wesley. All rights reserved. 20-21 Is the EU an Optimum Currency Area? (cont.) Deviations from the law of one price also occur in many EU markets. –If EU markets were greatly integrated, then the (currency adjusted) prices of goods and services should be nearly the same across markets. –The price of the same BMW car varies 29.5% between British and Dutch markets. –How much does price discrimination occur?
 Deviations from the law of one price also occur in many EU markets. –If EU markets were greatly integrated, then the (currency adjusted) prices of goods and services should be nearly the same across markets. –The price of the same BMW car varies 29.5% between British and Dutch markets. –How much does price discrimination occur .")
22
Copyright © 2009 Pearson Addison- Wesley. All rights reserved. 20-22 Is the EU an Optimum Currency Area? (cont.) There is also little evidence that regional migration is extensive in the EU. Europe has many languages and cultures, which hinder migration and labor mobility. Unions and regulations also impede labor movements between industries and countries.
 There is also little evidence that regional migration is extensive in the EU. Europe has many languages and cultures, which hinder migration and labor mobility. Unions and regulations also impede labor movements between industries and countries..")
23
Copyright © 2009 Pearson Addison- Wesley. All rights reserved. 20-23 Table 20-2: People Changing Region of Residence in the 1990s (percent of total population)
.")
24
Copyright © 2009 Pearson Addison- Wesley. All rights reserved. 20-24 Is the EU an Optimum Currency Area? (cont.) Evidence also shows that differences of US regional unemployment rates are smaller and less persistent than differences of national unemployment rates in the EU, indicating a lack of EU labor mobility.
 Evidence also shows that differences of US regional unemployment rates are smaller and less persistent than differences of national unemployment rates in the EU, indicating a lack of EU labor mobility..")
25
Copyright © 2009 Pearson Addison- Wesley. All rights reserved. 20-25 Is the EU an Optimum Currency Area? (cont.) There is evidence that financial assets were able to move more freely within the EU after 1992 and 1999. But capital mobility without labor mobility can make the economic stability loss greater. –After a reduction of aggregate demand in a particular EU country, financial assets could be easily transferred elsewhere while labor is stuck. –The loss of financial assets could further reduce production and employment.
 There is evidence that financial assets were able to move more freely within the EU after 1992 and But capital mobility without labor mobility can make the economic stability loss greater. –After a reduction of aggregate demand in a particular EU country, financial assets could be easily transferred elsewhere while labor is stuck. –The loss of financial assets could further reduce production and employment..")
26
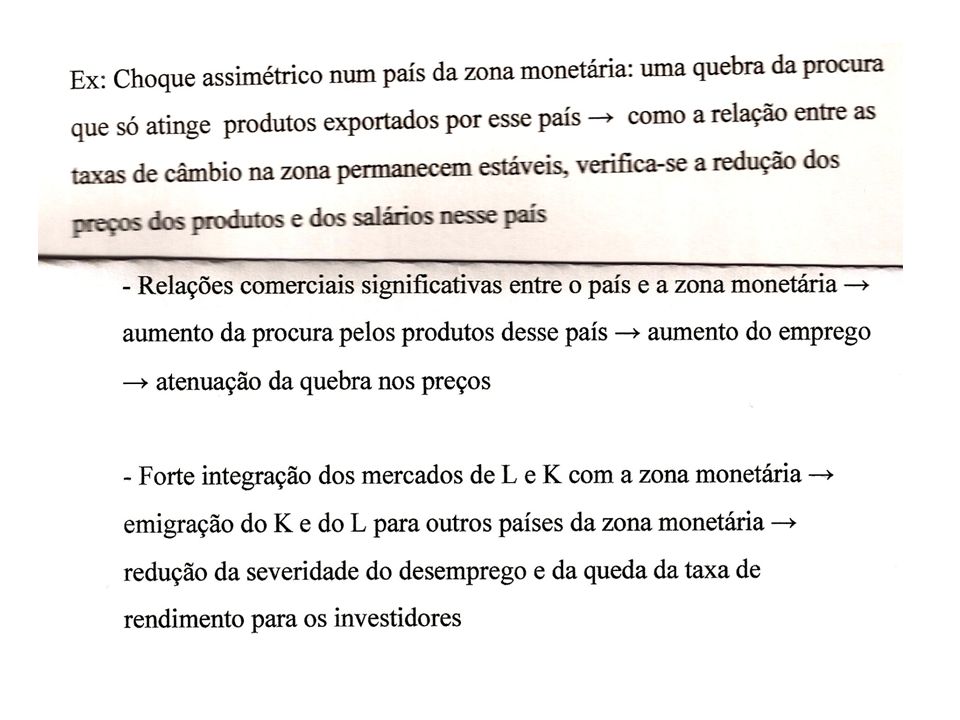
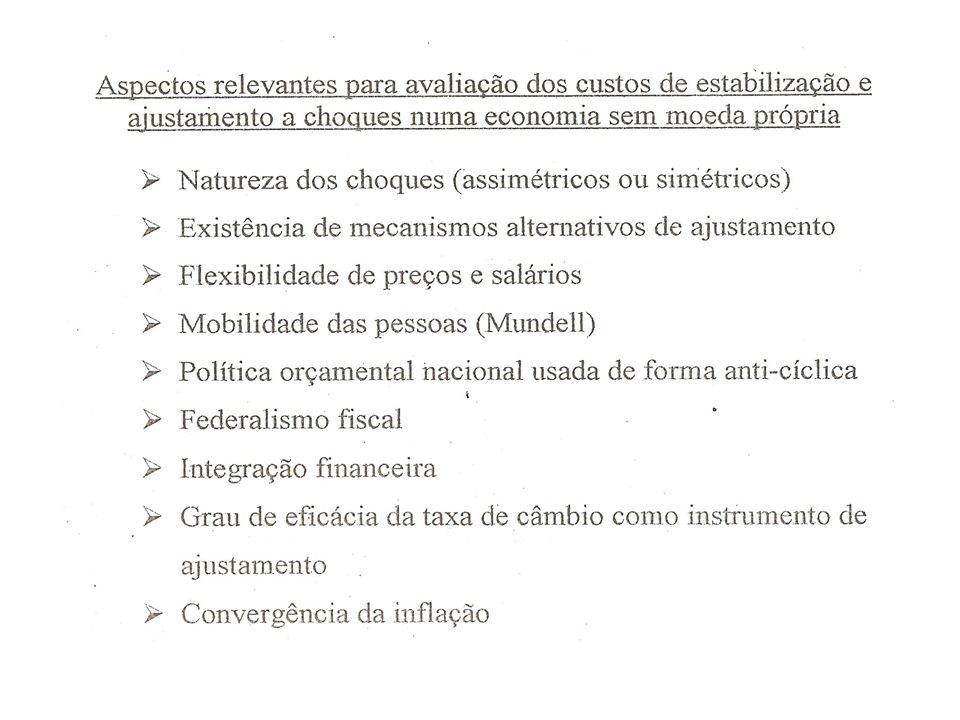
Copyright © 2009 Pearson Addison- Wesley. All rights reserved. 20-26 Other Considerations for an EMU The structure of the economies in the EUs economic and monetary union is important for determining how members respond to aggregate demand shocks. –The economies of EU members are similar in the sense that there is a high volume of intra-industry trade relative to the total volume. –They are different in the sense that Northern European countries have high levels of physical capital per worker and more skilled labor, compared with Southern European countries.

27
Copyright © 2009 Pearson Addison- Wesley. All rights reserved. 20-27 Other Considerations for an EMU (cont.) The amount of transfers among the EU members may also affect how EU economies respond to aggregate demand shocks. –Fiscal payments between countries in the EUs federal system, or fiscal federalism, may help offset the economic stability loss from joining an economic and monetary union. –But relative to inter-regional transfers in the U.S., little fiscal federalism occurs among EU members.
 The amount of transfers among the EU members may also affect how EU economies respond to aggregate demand shocks. –Fiscal payments between countries in the EUs federal system, or fiscal federalism, may help offset the economic stability loss from joining an economic and monetary union. –But relative to inter-regional transfers in the U.S., little fiscal federalism occurs among EU members..")
28
A visão neoliberal A política macroeconómica tem um papel menor na estabilização económica que deve ser atingida por um funcionamento eficiente dos mercados A política orçamental não perspectiva a expansão e combate ao desemprego O Estado deve financiar-se no mercado como qualquer agente económico A PM deve ter como objectivo único a estabilidade dos preços Independência da PM a cargo do Banco central

29
Balanço da UEM O crescimento económico desde a moeda única foi medíocre (pouco mais de 2% ao ano) O desemprego manteve-se em níveis elevados (em média 9% da população activa) Acumulação de défices elevados em relação ao exterior em algumas economias
 O desemprego manteve-se em níveis elevados (em média 9% da população activa) Acumulação de défices elevados em relação ao exterior em algumas economias")
30
Aumentar o capital do mecanismo de estabilização do euro Criar dívida pública europeia

31
Reformulação da UEM? Uma PM que tenha também como objectivos o combate ao desemprego, crescimento económico e taxa de câmbio do euro Política orçamental como estímulo ao crescimento e combate ao desemprego Financiamento monetário dos défices públicos em situação de crise Políticas microeconómicas orientadas para o serviço público

Apresentações semelhantes


>")
 Prof. Márcio Garcia.>")


 SEGUNDO NOVOS ESTRATOS VITÓRIA, ES – OUTUBRO 2008 Kenneth Camargo – IMS/UERJ Cláudia Medina – IESC/UFRJ.>")


. Uniform Resource Identifiers Uniform Resource Identifiers (URI) ou Identificador de Recursos Uniforme provê um meio.>")