Carregar apresentação
A apresentação está carregando. Por favor, espere

1
Mapping and monitoring earth dynamics from aerial imagery and InSAR
João Catalão LATTEX-IDL, University of Lisbon 109th Science Committee Meeting

2
Faculty of Sciences – University of Lisbon

3
LATTEX - IDL – Instituto D. Luis

4
Research activities/objectives
Geoid, Gravity Field Engineering projects (Cartographic production, photogrammetric applications) Remote Sensing (Interferometry - InSAR) Integration of multi-source geodetic data. This includes the integration of old geodetic measuring techniques, such as gravity and geoid, and also GPS, INSAR and satellite altimetry data assimilated into a dynamical mathematical model that reproduces the 4D position and velocity.
 Remote Sensing. (Interferometry - InSAR) Integration of multi-source geodetic data. This includes the integration of old geodetic measuring techniques, such as gravity and geoid, and also GPS, INSAR and satellite altimetry data assimilated into a dynamical mathematical model that reproduces the 4D position and velocity.")
5
Engineering projects (Engineering solutions for coastal dynamics studies) Photogrammetric analysis of the coastal erosion in Algarve (Portugal). Géomorphologie, nº 2, pp , 2002. Mean cliff retreat rate tendencies for Forte Novo - Garrão (Algarve - Portugal)”. Thalassas, 19(2b), , 2003. Airborne GPS / IMU integration for coastal studies in Ria Formosa. Measurement and monitoring landslides and cliff instability from multitemporal aerial photos. A video-based technique for mapping intertidal beach bathymetry.
. Géomorphologie, nº 2, pp , Mean cliff retreat rate tendencies for Forte Novo - Garrão (Algarve - Portugal) . Thalassas, 19(2b), , Airborne GPS / IMU integration for coastal studies in Ria Formosa. Measurement and monitoring landslides and cliff instability from multitemporal aerial photos. A video-based technique for mapping intertidal beach bathymetry.")
6
Photogrammetric analysis of the coastal erosion in Algarve
(Olhos de Água – Quarteira) J. Catalão(1), C. Catita(1), J.M. Miranda(1), J. A. Dias(2) (1) LATTEX, IDL, University of Lisbon (2) University of Algarve Photogrammetric analysis of the coastal erosion in Algarve (Portugal)." Géomorphologie, nº 2, pp , 2002.
 J. Catalão(1), C. Catita(1), J.M. Miranda(1), J. A. Dias(2) (1) LATTEX, IDL, University of Lisbon. (2) University of Algarve. Photogrammetric analysis of the coastal erosion in Algarve (Portugal). Géomorphologie, nº 2, pp ,")
7
Objective Evaluate the applicability of photogrammetric techniques to the monitoring of coastal erosion based on a long-term multi-temporal set of metric photos, running from 1938 to 1995. The study area corresponds to a segment of the Algarve coast between Olhos de Água beach and Quarteira river. Due to the irregularity of the erosion processes near the natural water lines, we selected two study zones. PORTUGAL

8
Study Area photo

9
Study Area photo Falésia Beach Vilamoura Marine

10
Methodology Determination of photogrammetric points for the most recent photos Perform a multi-temporal aerotriangulation Photogrammetric profiles Construction of a DTM Linear analysis and volume computation Positional and temporal uncertainty Accuracy estimation

11
Data 1. Determination of the internal and external orientation parameters. 2. Multi-temporal aerotriangulation with 1995, 1976 and 1972 epochs. We use this framework to determine natural control points for the 1976 and 1972 surveys. After computation of the external orientation parameters of the 1972 survey, similar operation was made in what concerns the 1969, 1958 and 1938 epochs.

12
Digitised Features

13
Photogrammetric profiles

14
Photogrammetric profiles

15
Cliff top line evolution

16
Time evolution of the cliff geometry

17
Positional uncertainty
0.76 m + 14m x Scale (misinterpretation of the delimitation) gives 1.1 m
 gives 1.1 m.")
18
Positional uncertainty
Upper limit Lower limit Lower : 0.14 m yr-1 Upper: 0.20 m yr-1

19
Airborne GPS / IMU integration for coastal studies in Ria Formosa.
Célia Sousa, J. Catalão Mean cliff retreat rate tendencies for Forte Novo - Garrão (Algarve - Portugal) S. Oliveira, J. Catalão, J. Dias
 S. Oliveira, J. Catalão, J. Dias.")
20
Objective Integration of GPS/IMU coordination system on the aerotriangulation process (using BINGO software). Multiparametric AT with GPS+IMU+Photogrametric points. Evaluation of the effect of photogrammetric points reduction on the aerotriangulation process and its effect on the derived photogrammetric restitution. To develop a comprehensive evolutionary model for Forte Novo - Garrão shoreline/cliff retreat rate and its relation with close man made constructions, Quarteira fishing harbour and Vale do Lobo artificial beach nourishment. (Evaluation of cliff retreat and beach nourishment in Southern Portugal through photogrammetric techniques, S. Cruz de Oliveira, J. Catalão, Ó. Ferreira & J. M. Alveirinho Dias, sent to Journal of Coastal Research.)
. Multiparametric AT with GPS+IMU+Photogrametric points. Evaluation of the effect of photogrammetric points reduction on the aerotriangulation process and its effect on the derived photogrammetric restitution. To develop a comprehensive evolutionary model for Forte Novo - Garrão shoreline/cliff retreat rate and its relation with close man made constructions, Quarteira fishing harbour and Vale do Lobo artificial beach nourishment. (Evaluation of cliff retreat and beach nourishment in Southern Portugal through photogrammetric techniques, S. Cruz de Oliveira, J. Catalão, Ó. Ferreira & J. M. Alveirinho Dias, sent to Journal of Coastal Research.)")
21
Study Area Lagoon system with a 60 km dune chain
In this conditions how can we do the aerial photo orientation?

22
Aerial photos strips 4 Surveys: 1991 1999 2000 (GPS) 2001 (GPS+IMU)
 2001 (GPS+IMU)")
23
External orientation determination
1991, 1999, 2000, 2001 – AeroTriangulation GPS+INS TA +GPS+IMU TA +GPS+IMU (reducing the number of PFs) 2001 Survey with GPS+IMU
 2001 Survey with GPS+IMU.")
24
Photogrammetric points determination

25
Statistics for Quarteira-Ancão
Std X (m) Std Y (m) Std H (m) Std (°) Std (°) Std k (°) TA – IMU 0.536 0.632 1.011 0.024 0.022 0.014 IMU - TA/IMU 0.016 0.021 0.435 0.007 0.004 0.009 TA - TA/IMU 0.619 0.779 0.023 0.008 Mean X (m) Mean Y (m) Mean H (m) mean (°) Mean (°) mean k (°) TA - IMU 1.047 -0.716 -0.144 -0.010 0.010 -1.289 0.553 -0.018 -0.004 0.002 -0.019 -0.242 -0.163 -0.162 -0.014 0.012 0.001 TA and GPS/IMU differences along the strip
 Std Y (m) Std H (m) Std (°) Std (°) Std k (°) TA – IMU IMU - TA/IMU TA - TA/IMU Mean X (m) Mean Y (m) Mean H (m) mean (°) Mean (°) mean k (°) TA - IMU TA and GPS/IMU differences along the strip.")
26
Photogrammetric points reduction
Standard deviation of the photogrammetric points coordinates as a function of the number of PFs used on the TA with GPS+IMU

27
Data integration and Analysis
2001 1991 1999 Cliff top line 2001 Cliff top line 1999 Cliff top line 1991

28
Retreat Rate East groin of Quarteira

29
LATTEX, IDL, University of Lisbon
InSAR Projects C. Catita & J. Catalão LATTEX, IDL, University of Lisbon

30
Projects - FCT SARAZORES - Deformation Partition in Azores using interferometric SAR Images ( ) The main goal of this project was to develop an integrated technique, based on SAR interferometry and GPS, to measure inter-seismic, co-seismic, and post-seismic deformation and the partition of the deformation between volcanic and tectonic effects, by relating these to seismicity and geological structures, and probe plate boundary kinematics. KARMA - Kinematics and Rheological Modelling of the Nubian-Eurasian plate boundary in the Azores ( ) The specific objectives of this project are: 1. Implementation of a near-real time continuous GPS network, 2. Processing and interpretation of a SAR multi-temporal imagery over Faial Island using interferometric techniques (with radar reflectors) to infer ground deformation, , etc..
 The specific objectives of this project are: 1. Implementation of a near-real time continuous GPS network, 2. Processing and interpretation of a SAR multi-temporal imagery over Faial Island using interferometric techniques (with radar reflectors) to infer ground deformation, , etc..")
31
Projects - ESA 1. Deformation Partition in Azores using interferometric SAR images. ESA-EO, CAT-1 project, no 1074. 2. Ground deformation of Azores islands based on INSAR, corner reflectors and GPS. ESA-EO, CAT-1 project, no 3149.

32
C. Catita, J. Catalão, M. Miranda, L.M.Victor
The July 9, 1998 Pico-Faial, Azores, Earthquake: Co-seismic Deformation Detected by Radar Interferometry C. Catita, J. Catalão, M. Miranda, L.M.Victor Time series analysis of SAR data applied to the study of the co-seismic deformation of the 9th July 1998 Pico-Faial (Azores) earthquake. International Journal of Remote Sensing, Vol. 26, No 13, 10 July 2005,
 earthquake. International Journal of Remote Sensing, Vol. 26, No 13, 10 July 2005,")
33
The July 9, 1998 Pico-Faial, earthquake
Time: 05:19:15 (GMT); Magnitude: Mw = 6.1 Epicenter : 38º 38.05’ ± 2.2’ N , 28º 31.38’ ± 3.4’ E More than 150 aftershocks observed between 9th and 15th of July.
; Magnitude: Mw = 6.1. Epicenter : 38º 38.05’ ± 2.2’ N , 28º 31.38’ ± 3.4’ E. More than 150 aftershocks observed between 9th and 15th of July.")
34
Previous Geodetic Studies
TANGO Project (TransAtlantic Network for Geodynamics and Oceanography) GPS measurements in 1993, 1994, 1997 e 1999 IGP (Instituto Geográfico Português) GPS observations in 1997 GPS re-observations in August of 1998 (Faial) : 30 sites No GPS data available in PICO Island. Fernandes, R. M. S., J. M. Miranda, J. Catalão, J. F. Luis, L. Bastos, B.A.C. Ambrosious (2002) “Coseismic Displacements of the Mw=6.1, July 9, 1998, Faial Earthquake (Azores, North Atlantic)”. Geophysical Research Letters, Vol. 29, N. 16, pp. 21-1, DOI: /2001GL
 GPS measurements in 1993, 1994, 1997 e IGP (Instituto Geográfico Português) GPS observations in GPS re-observations in August of 1998 (Faial) : 30 sites. No GPS data available in PICO Island. Fernandes, R. M. S., J. M. Miranda, J. Catalão, J. F. Luis, L. Bastos, B.A.C. Ambrosious (2002) Coseismic Displacements of the Mw=6.1, July 9, 1998, Faial Earthquake (Azores, North Atlantic) . Geophysical Research Letters, Vol. 29, N. 16, pp. 21-1, DOI: /2001GL")
35
Coseismic displacement modeling derived from the geodetic studies
Inversion of GPS data was performed using a non linear generalized algorithm. 2 solutions were studied.

36
Radar Images To use SAR Interferometry to characterize the coseismic displacement field and determine if there is agreement with the previous geodetic studies. SECOND TRACK FIRST TRACK ERS1 and ERS2 images 17 images acquired between 1992 and 1998 10 interferograms produced; 2 independent tracks (descending orbits) ; .
 ; .")
37
Methodology To isolate surface deformations from the interferograms, the topography was removed by subtracting a synthetic fringe produced by using the DEM of the area of interest (DEME approach developed by CNES). A DEM was produced by digitizing contour lines and spot height data from the existing 1:25000 scale topographic maps produced by the Instituto Geográfico do Exército (horizontal resolution 20 m and vertical accuracy 5 m). On the presented interferograms, the magnitude of the expected topographic artifact was estimated to be of the order of: (best co-seismic pair) rms/Ha 1/55 cycles or 0.5 mm in range (worst co-seismic pair) rms/Ha 1/16 cycles or 1.7 mm in range
. A DEM was produced by digitizing contour lines and spot height data from the existing 1:25000 scale topographic maps produced by the Instituto Geográfico do Exército (horizontal resolution 20 m and vertical accuracy 5 m). On the presented interferograms, the magnitude of the expected topographic artifact was estimated to be of the order of: (best co-seismic pair) rms/Ha 1/55 cycles or 0.5 mm in range. (worst co-seismic pair) rms/Ha 1/16 cycles or 1.7 mm in range.")
38
INTERFEROGRAMS IN DEM GEOMETRY
FIRST TRACK INTERFEROGRAMS IN DEM GEOMETRY Interferogram A Interferogram B

39
INTERFEROGRAMS IN DEM GEOMETRY
SECOND TRACK INTERFEROGRAMS IN DEM GEOMETRY Interferogram C Interferogram D

40
Synthetic Interferograms
Unit vector pointing from the ground toward the satellite: [east, north, up] = [-0.341,0.075,-0.937]

41
Conclusions 1. Despite several unfavorable factors and the consequent low level of coherence, the interferometry SAR method has been successfully used for measuring the ground displacement changes in Pico Island. 2. The deformation pattern observed on NW of Pico Island (3 to 4 cm of range change, which correspond to an increase in ground-to-radar distance between the two acquisition dates) agrees well with the previous geodetic results and the theoretical model presented by Fernandes et al. [2002]. We interpret this range change as the expression of elastic deformation generated by the July 9th Faial earthquake
 agrees well with the previous geodetic results and the theoretical model presented by Fernandes et al. [2002]. We interpret this range change as the expression of elastic deformation generated by the July 9th Faial earthquake.")
42
KARMA Project ( )
")
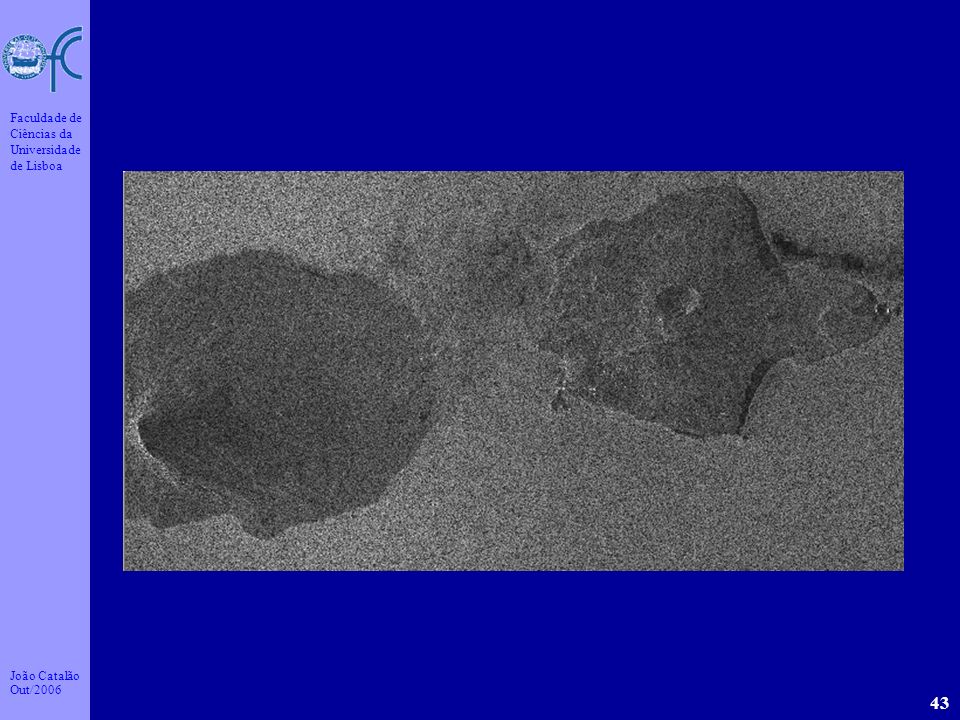
44
Coherence DEM

45
Interferogram Interferogram After DEM removal

46
Amplitude image and Persistent Scaterrers
PS obtained from amplitude dispersion

47
Corner Reflectors

48
Corner Reflectors

49
Welcome to Lisbon Welcome to Portugal Thank you

Apresentações semelhantes

 – Lápides 1, 2, 3» «nomes gravados, 21 de Agosto de 2008» «Ultramar.TerraWeb»>")


. Nenhuns direitos reservados, excepto para fins comerciais. Por favor, não coloque.>")

 Rector of University.>")


 2003 by Valery Sklyarov and Iouliia Skliarova: DETUA, IEETA, Aveiro University, Portugal.>")
 2.Comparação.>")


