Carregar apresentação
A apresentação está carregando. Por favor, espere

1
Energy Management: 2013/2014 Industrial Energy Use SGCIE and Primary Energy Evaluation Methods Class # 6 Prof. Tânia Sousa taniasousa@ist.utl.pt

2
Cement, ceramics, glass, lime Aluminium, copper, nickel Plastics and fertilizers GEA, 2012 Final Energy Use in Industry in 2005

3
World Industrial final energy use in 2005 is 115EJ The bulk of industrial energy use is due to the production of a small number of energy intensive commodities: –Chemicals and petrochemicals and the iron and steel sector account for approximately half of all industrial energy used worldwide. Other sectors that account for a significant share of industrial energy use: – non-ferrous metals, non-metallic minerals and the pulp and paper sector. Cement, ceramics, glass, lime Aluminium, copper, nickel Plastics and fertilizers GEA, 2012

4
Final Energy Use in Industry in 2005 The bulk of industrial energy use is in developing economies (80% pop.)
")
5
World production of key materials Higher growth rates from the 90 and then from the 2000 onwards

6
World production of key materials Higher growth rates from the 90 and then from the 2000 onwards Heterogeneous growth

7
World Production of key materials Growth rates between 2000-2007 –Per-capita demand for materials increases with income and economic development and then stabilizes

8
World Production of key materials Growth rates between 2000-2007 –Per-capita demand for materials increases with income and economic development and then stabilizes (exceptions: paper and aluminium) China is atypical
 China is atypical")
9
World Production of key materials Growth rates between 2000-2007 –Per-capita demand for materials increases with income and economic development and then stabilizes (exceptions: paper and aluminium)
")
10
Industrial Energy Intensity Industrial energy intensity - energy use per unit of production or VA (UNIDO, 2010): –It differs between different products and sectors –And for the same products/sector?
: –It differs between different products and sectors –And for the same products/sector")
11
Industrial Energy Intensity Industrial energy intensity - energy use per unit of production or VA (UNIDO, 2010): –It differs between different products and sectors –It changes in time due to technological inovations
: –It differs between different products and sectors –It changes in time due to technological inovations")
12
Industrial Energy Intensity Industrial energy intensity - energy use per unit of production or VA (UNIDO, 2010): –It differs between different products and sectors –It changes in time due to technological inovations
: –It differs between different products and sectors –It changes in time due to technological inovations")
13
Industrial energy intensity - energy use per unit of production or VA (UNIDO, 2010): –It differs between countries for similar products Industrial Energy Intensity
: –It differs between countries for similar products Industrial Energy Intensity")
14
Industrial energy intensity - energy use per unit of production or VA (UNIDO, 2010): –It differs between countries for similar products WHY? Industrial Energy Intensity

15
Industrial energy intensity - energy use per unit of production or VA (UNIDO, 2010): –It differs between countries for similar products Access to resources (steel from steel recycling is 8 GJ/ton while from iron ore is 20.6 GJ/ton) Energy Prices Plant size and age of capital stock Capital cost (more efficient capital is also more expensive - interest rates) Awareness of energy efficiency measures and opportunity cost Government policies
: –It differs between countries for similar products Access to resources (steel from steel recycling is 8 GJ/ton while from iron ore is 20.6 GJ/ton) Energy Prices Plant size and age of capital stock Capital cost (more efficient capital is also more expensive - interest rates) Awareness of energy efficiency measures and opportunity cost Government policies")
16
Energy Benchmark Curve Management tool to compare similar plants in energy use and energy efficiency (improvment potential) more efficient Energy efficiency index Specific energy consumption
 more efficient Energy efficiency index Specific energy consumption")
17
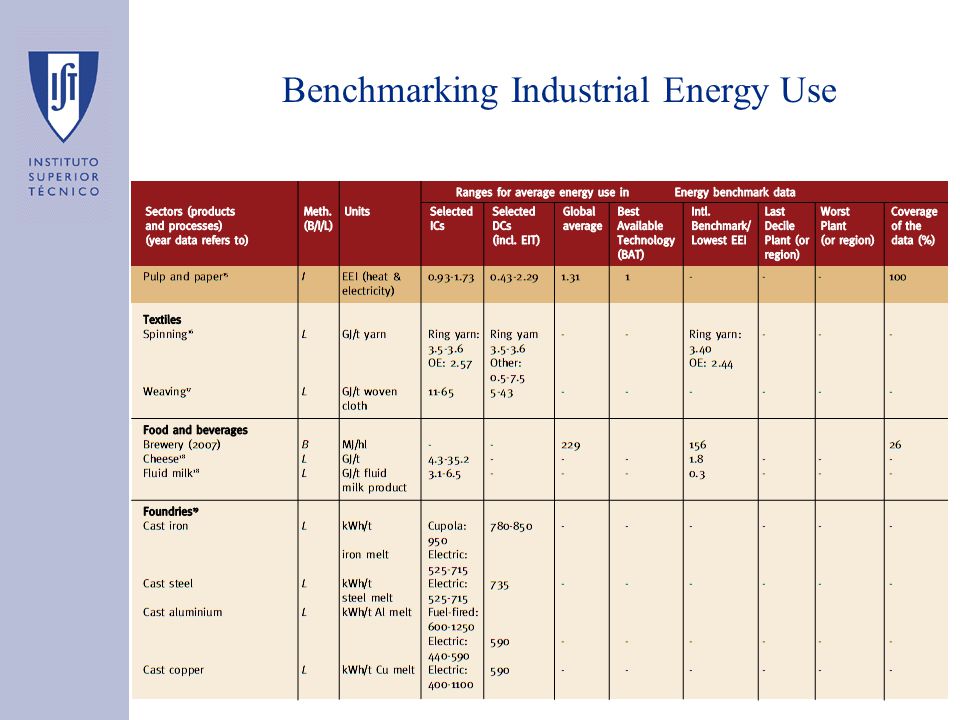
Benchmarking Industrial Energy Use

19
Average 10-20% or 30-35% improvment potential –Lower than for other energy uses (e.g. in buildings is close to 50%)
.")
20
World Sankey Diagram in 2005 IAASA – Global Energy Assessment 2012

21
Industrial Energy Intensity Industrial energy intensity (energy use per unit of VA): –Depends on what?
: –Depends on what")
22
Industrial Energy Intensity Industrial energy intensity (energy use per unit of VA): –Efficiency –Sectoral Structure
: –Efficiency –Sectoral Structure")
23
Industrial energy intensity (energy use per unit of VA): –Efficiency –Sectoral Structure Industrial Energy Intensity
: –Efficiency –Sectoral Structure Industrial Energy Intensity")
24
Energy Use in Industry

25
SGCIE (DL 71/2008) – Sistema de Gestão dos Consumos Intensivos de Energia (Energy Management System for Intensive Energy Consumers) SGCIE
 – Sistema de Gestão dos Consumos Intensivos de Energia (Energy Management System for Intensive Energy Consumers) SGCIE")
26
SGCIE (DL 71/2008) – Sistema de Gestão dos Consumos Intensivos de Energia (Energy Management System for Intensive Energy Consumers) –It promotes energy efficiency for big primary energy consumers –It promotes clean primary energy fuels mix SGCIE
 – Sistema de Gestão dos Consumos Intensivos de Energia (Energy Management System for Intensive Energy Consumers) –It promotes energy efficiency for big primary energy consumers –It promotes clean primary energy fuels mix SGCIE")
27
Energy Management Class # 6 :: Block Diagrams (cont.) & LCA & SGCIE SGCIE Domain of Application –All entities with an annual primary energy consumption higher than 500 toe (1 toe = 41868 MJ) –Exceptions: Cogeneration facilities, transport entities and buildings Supervision –DGEG Management –ADENE
 & LCA & SGCIE SGCIE Domain of Application –All entities with an annual primary energy consumption higher than 500 toe (1 toe = MJ) –Exceptions: Cogeneration facilities, transport entities and buildings Supervision –DGEG Management –ADENE")
28
Energy Management Class # 6 :: Block Diagrams (cont.) & LCA & SGCIE SGCIE Obligations (for IEC entities) –Promote the registration of facilities –Perform Energy Audits Every 6 years for entities 1000 toe Every 8 years for entities from 500 to 1000 toe
 & LCA & SGCIE SGCIE Obligations (for IEC entities) –Promote the registration of facilities –Perform Energy Audits Every 6 years for entities 1000 toe Every 8 years for entities from 500 to 1000 toe")
29
Energy Management Class # 6 :: Block Diagrams (cont.) & LCA & SGCIE SGCIE Obligations (for IEC entities) –Develop Energy Racionalization Plans Every measure with payback lower than 5 years must be implemented in the first 3 years for entities 1000 toe Every measure with payback lower than 3 years must be implemented in the first 3 years for entities from 500-1000 toe
 & LCA & SGCIE SGCIE Obligations (for IEC entities) –Develop Energy Racionalization Plans Every measure with payback lower than 5 years must be implemented in the first 3 years for entities 1000 toe Every measure with payback lower than 3 years must be implemented in the first 3 years for entities from toe")
30
Energy Management Class # 6 :: Block Diagrams (cont.) & LCA & SGCIE SGCIE Obligations (for IEC entities) –Develop Energy Racionalization Plans Energy Intensity must decrease 6% in 6 years for entities 1000 toe Energy Intensity must decrease 4% in 8 years for entities from 500 to 1000 toe
 & LCA & SGCIE SGCIE Obligations (for IEC entities) –Develop Energy Racionalization Plans Energy Intensity must decrease 6% in 6 years for entities 1000 toe Energy Intensity must decrease 4% in 8 years for entities from 500 to 1000 toe")
31
Energy Management Class # 6 :: Block Diagrams (cont.) & LCA & SGCIE SGCIE What is the relationship between the Energy Intensity obtained using the definition in SGCIE and the energy specific consumption obtained with the block diagrams methodology?
 & LCA & SGCIE SGCIE What is the relationship between the Energy Intensity obtained using the definition in SGCIE and the energy specific consumption obtained with the block diagrams methodology")
32
Energy Management Class # 6 :: Block Diagrams (cont.) & LCA & SGCIE SGCIE The Energy Intensity obtained using the definition in SGCIE is the same obtained with the block diagrams methodology if: –There is only one product –The energy specific consumptions of the inputs is zero 8 (produção 1) A C D E B 2 1 F G 14 13 12 11 Electricity Fueloil
 & LCA & SGCIE SGCIE The Energy Intensity obtained using the definition in SGCIE is the same obtained with the block diagrams methodology if: –There is only one product –The energy specific consumptions of the inputs is zero 8 (produção 1) A C D E B 2 1 F G Electricity Fueloil")
33
Energy Management Class # 6 :: Block Diagrams (cont.) & LCA & SGCIE SGCIE Obligations (for IEC entities) –Develop Energy Rationalization Plans The carbon intensity must not increase –Why a goal on carbon intensity?
 & LCA & SGCIE SGCIE Obligations (for IEC entities) –Develop Energy Rationalization Plans The carbon intensity must not increase –Why a goal on carbon intensity")
34
Energy Management Class # 6 :: Block Diagrams (cont.) & LCA & SGCIE SGCIE Obligations (for IEC entities) –Develop Energy Rationalization Plans The carbon intensity must not increase –Why a goal on carbon intensity? Promote less polutant energy mixes (do not increase energy efficiency by replacing less polutant energy forms with more polutant ones)
.")
35
SGCIE Conversion coefficients for CO 2 emissions and primary energy –Despacho nº 17313/2008

36
SGCIE Conversion coefficients for CO 2 e emissions and primary energy –For primary fuels:

37
SGCIE Conversion coefficients for primary energy –For electricity (in kWh per toe)? BALANÇO ENERGÉTICO tep Total de Carvão Total de Petróleo Gás Natural (*) Termo- electricida de Lenhas e Resíduos Vegetais Resíduos Sólidos Urbanos Biogás 2008 4 = 1 a 322= 15 + 212335404144 Electricidade 6.62 444 703 475 5711 970 751-2 325 570 61 957 182 765 19 729 Thermoelectricity produced with coal, oil, natural gas, biomass, urban waste and biogas
 Termo- electricida de Lenhas e Resíduos Vegetais Resíduos Sólidos Urbanos Biogás = 1 a 322= Electricidade Thermoelectricity produced with coal, oil, natural gas, biomass, urban waste and biogas.")
38
SGCIE Conversion coefficients for primary energy –For electricity: BALANÇO ENERGÉTICO tep Total de Carvão Total de Petróleo Gás Natural (*) Termo- electricida de Lenhas e Resíduos Vegetais Resíduos Sólidos Urbanos Biogás 2008 4 = 1 a 322= 15 + 212335404144 Electricidade 6.62 444 703 475 5711 970 751-2 325 570 61 957 182 765 19 729 Thermoelectricity produced with coal, oil, natural gas, biomass, urban waste and biogas
 Termo- electricida de Lenhas e Resíduos Vegetais Resíduos Sólidos Urbanos Biogás = 1 a 322= Electricidade Thermoelectricity produced with coal, oil, natural gas, biomass, urban waste and biogas")
39
SGCIE Conversion coefficients for primary energy –For electricity: –What would happen to this coefficient if we consider cogeneration? BALANÇO ENERGÉTICO tep Total de Carvão Total de Petróleo Gás Natural (*) Termo- electricida de Lenhas e Resíduos Vegetais Resíduos Sólidos Urbanos Biogás 2008 4 = 1 a 322= 15 + 212335404144 Electricidade 6.62 444 703 475 5711 970 751-2 325 570 61 957 182 765 19 729 Thermoelectricity produced with coal, oil, natural gas, biomass, urban waste and biogas
 Termo- electricida de Lenhas e Resíduos Vegetais Resíduos Sólidos Urbanos Biogás = 1 a 322= Electricidade Thermoelectricity produced with coal, oil, natural gas, biomass, urban waste and biogas.")
40
SGCIE Conversion coefficients for primary energy –For electricity: BALANÇO ENERGÉTICO tep Total de Carvão Total de Petróleo Gás Natural (*) Termo- electricida de Lenhas e Resíduos Vegetais Resíduos Sólidos Urbanos Biogás 2008 4 = 1 a 322= 15 + 212335404144 Electricidade 6.62 444 703 475 5711 970 751-2 325 570 61 957 182 765 19 729 Thermoelectricity produced with coal, oil, natural gas, biomass, urban waste and biogas BALANÇO ENERGÉTICO tep Total de Petróleo Gás Natural (*) Gases o Outros Derivado s Termo- electricidade Calor Resíduos Industriais Renováveis Sem Hídrica 2008 22= 15 + 21 23 30 = 24 a 29 35373846 = 39 a 45 Cogeração 6.7 834 520 626 392 24 379- 485 426-1 472 450 2 523 974 514
 Termo- electricida de Lenhas e Resíduos Vegetais Resíduos Sólidos Urbanos Biogás = 1 a 322= Electricidade Thermoelectricity produced with coal, oil, natural gas, biomass, urban waste and biogas BALANÇO ENERGÉTICO tep Total de Petróleo Gás Natural (*) Gases o Outros Derivado s Termo- electricidade Calor Resíduos Industriais Renováveis Sem Hídrica = = 24 a = 39 a 45 Cogeração")
41
SGCIE Conversion coefficients for CO 2 emissions –For electricity (in kg CO 2 e per kWh)? BALANÇO ENERGÉTICO tep Total de Carvão Total de Petróleo Gás Natural (*) Termo- electricidade Lenhas e Resíduos Vegetais Resíduos Sólidos Urbanos Biogás 2008 4 = 1 a 322= 15 + 212335404144 Electricidade 6.62 444 703 475 5711 970 751-2 325 570 61 957 182 765 19 729 4111.4 kg CO 2 e/toe 3236.4 kg CO 2 e/toe 2348.8 kg CO 2 e/toe
 Termo- electricidade Lenhas e Resíduos Vegetais Resíduos Sólidos Urbanos Biogás = 1 a 322= Electricidade kg CO 2 e/toe kg CO 2 e/toe kg CO 2 e/toe.")
42
SGCIE Conversion coefficients for CO 2 emissions –For electricity (in kg CO 2 e per kWh) BALANÇO ENERGÉTICO tep Total de Carvão Total de Petróleo Gás Natural (*) Termo- electricidade Lenhas e Resíduos Vegetais Resíduos Sólidos Urbanos Biogás 2008 4 = 1 a 322= 15 + 212335404144 Electricidade 6.62 444 703 475 5711 970 751-2 325 570 61 957 182 765 19 729 4111.4 kg CO 2 e/toe 3236.4 kg CO 2 e/toe 2348.8 kg CO 2 e/toe
 BALANÇO ENERGÉTICO tep Total de Carvão Total de Petróleo Gás Natural (*) Termo- electricidade Lenhas e Resíduos Vegetais Resíduos Sólidos Urbanos Biogás = 1 a 322= Electricidade kg CO 2 e/toe kg CO 2 e/toe kg CO 2 e/toe")
43
Energy Management Class # 6 :: Block Diagrams (cont.) & LCA & SGCIE SGCIE Conversion coefficients for CO 2 emissions and primary energy –For electricity: –Conversão directa de kWh em tep?
 & LCA & SGCIE SGCIE Conversion coefficients for CO 2 emissions and primary energy –For electricity: –Conversão directa de kWh em tep")
44
Energy Management Class # 6 :: Block Diagrams (cont.) & LCA & SGCIE SGCIE Conversion coefficients for CO 2 emissions and primary energy –For electricity: –Conversão directa de kWh em tep? 1kWh=3.6MJ=3.610 -3 /41.87 tep = 86 10 -6

45
Energy Management Class # 6 :: Block Diagrams (cont.) & LCA & SGCIE SGCIE Conversion coefficients for CO 2 emissions and primary energy –For vapor:
 & LCA & SGCIE SGCIE Conversion coefficients for CO 2 emissions and primary energy –For vapor:")
46
Energy Management Class # 6 :: Block Diagrams (cont.) & LCA & SGCIE
 & LCA & SGCIE")
47
Energy Management Class # 6 :: Block Diagrams (cont.) & LCA & SGCIE
 & LCA & SGCIE")
48
Energy Management Class # 6 :: Block Diagrams (cont.) & LCA & SGCIE
 & LCA & SGCIE")
49
Energy Management Class # 6 :: Block Diagrams (cont.) & LCA & SGCIE
 & LCA & SGCIE")
50
Energy Management Class # 6 :: Block Diagrams (cont.) & LCA & SGCIE
 & LCA & SGCIE")
51
Energy Management Class # 6 :: Block Diagrams (cont.) & LCA & SGCIE
 & LCA & SGCIE")
52
Energy Management Class # 6 :: Block Diagrams (cont.) & LCA & SGCIE Exercise A factory produces 2 end products: P1 and P2. These products follow the production process shown in the diagram below, with P1 = 50000 ton/year and P2 = 30000 ton/year. The operation G treats the effluents from E and F. These two (E and F) are the only productive operations that generate waste, and S E = 1.2, S F = 1.3. In operation G, only 20% of the input effluent, exits the process as waste. The values of composition are as follows: f 4 = 0.4, f 6 = 0.5. The table presents the specific consumption of each operation. Consider that for electricity: 0.215 kgep/kWh & 0.47 kg CO 2 e/KWh and for fueloil 0.984 kgep/kg & 3236.4 kg CO 2 e/toe a)What is the carbon intensity of this factory? 8 (produção 1) A C D E B 2 1 F G 14 13 12 11 10 (produção 2) 3 4 5 6 7 9
 are the only productive operations that generate waste, and S E = 1.2, S F = 1.3. In operation G, only 20% of the input effluent, exits the process as waste. The values of composition are as follows: f 4 = 0.4, f 6 = 0.5. The table presents the specific consumption of each operation. Consider that for electricity: kgep/kWh & 0.47 kg CO 2 e/KWh and for fueloil kgep/kg & kg CO 2 e/toe a)What is the carbon intensity of this factory. 8 (produção 1) A C D E B 2 1 F G (produção 2)")
53
Energy Management Class # 6 :: Block Diagrams (cont.) & LCA & SGCIE Exercise 8 (produção 1) A C D E B 2 1 F G 14 13 12 11 10 (produção 2) 3 4 5 6 7 9
 & LCA & SGCIE Exercise 8 (produção 1) A C D E B 2 1 F G (produção 2)")
54
Primary Energy Valuation Methods Primary Energy flows that are not heat are not easily compared with the heat that fuels can deliver (e.g. ….)
.")
55
Primary Energy used for Electricity What is the primary energy associated with the electricity production in 2008? BALANÇO ENERGÉTICO tep Total de Carvão Total de Petróleo Gás Natural (*) Gases o Outros Derivados Total de Eectricidade Calor Resíduos Industriais Renováveis Sem Hídrica TOTAL GERAL 2008 4 = 1 a 322= 15 + 212330 = 24 a 2936 = 31 a 35373846 = 39 a 45 47=4+22+23+30+36+3 7+38+46 IMPORTAÇÕES1.2 327 21916 608 3844 163 167 923 984 24 022 754 PRODUÇÃO DOMÉSTICA 2. 1 142 338 39 8003 190 6794 372 817 VARIAÇÃO DE "STOCKS" 3.- 223 603 315 673 5 960 - 837 97 193 SAÍDAS 4. 24 9493 680 661 112 918 17 6343 836 162 CONSUMO DE ENERGIA PRIMÁRIA 5.2 525 87312 612 0504 157 207 1 953 404 39 8003 173 88224 462 216 PARA NOVAS FORMAS DE ENERGIA6.2 444 7031 079 1372 597 143 -2 810 996-1 472 450 1 1201 367 3913 206 048 Electricidade 6.62 444 703 475 5711 970 751 -2 325 570 264 4512 829 906 Cogeração 6.7 834 520 626 392 24 379- 485 426-1 472 450 2 523 974 514 504 452 CONSUMO DO SECTOR ENERGÉTICO7. 475 376 56 103 605 301 270 736 31 407 519 CONSUMO COMO MATÉRIA PRIMA 1 275 842 DISPONÍVEL PARA CONSUMO FINAL8. 81 1709 781 6951 503 961 4 159 0991 201 714 38 6801 806 48818 572 807
 Gases o Outros Derivados Total de Eectricidade Calor Resíduos Industriais Renováveis Sem Hídrica TOTAL GERAL = 1 a 322= = 24 a 2936 = 31 a = 39 a 45 47= IMPORTAÇÕES PRODUÇÃO DOMÉSTICA VARIAÇÃO DE STOCKS SAÍDAS CONSUMO DE ENERGIA PRIMÁRIA PARA NOVAS FORMAS DE ENERGIA Electricidade Cogeração CONSUMO DO SECTOR ENERGÉTICO CONSUMO COMO MATÉRIA PRIMA DISPONÍVEL PARA CONSUMO FINAL")
56
BALANÇO ENERGÉTICO tep Total de Carvão Total de Petróleo Gás Natural (*) Gases o Outros Derivados Total de Eectricidade Calor Resíduos Industriais Renováveis Sem Hídrica TOTAL GERAL 2008 4 = 1 a 322= 15 + 212330 = 24 a 2936 = 31 a 35373846 = 39 a 45 47=4+22+23+30+36+3 7+38+46 IMPORTAÇÕES1.2 327 21916 608 3844 163 167 923 984 24 022 754 PRODUÇÃO DOMÉSTICA 2. 1 142 338 39 8003 190 6794 372 817 VARIAÇÃO DE "STOCKS" 3.- 223 603 315 673 5 960 - 837 97 193 SAÍDAS 4. 24 9493 680 661 112 918 17 6343 836 162 CONSUMO DE ENERGIA PRIMÁRIA 5.2 525 87312 612 0504 157 207 1 953 404 39 8003 173 88224 462 216 PARA NOVAS FORMAS DE ENERGIA6.2 444 7031 079 1372 597 143 -2 810 996-1 472 450 1 1201 367 3913 206 048 Electricidade 6.62 444 703 475 5711 970 751 -2 325 570 264 4512 829 906 Cogeração 6.7 834 520 626 392 24 379- 485 426-1 472 450 2 523 974 514 504 452 CONSUMO DO SECTOR ENERGÉTICO7. 475 376 56 103 605 301 270 736 31 407 519 CONSUMO COMO MATÉRIA PRIMA 1 275 842 DISPONÍVEL PARA CONSUMO FINAL8. 81 1709 781 6951 503 961 4 159 0991 201 714 38 6801 806 48818 572 807 Primary Energy used for Electricity What is the primary energy associated with the electricity production in 2008?

57
Primary Energy used for Electricity Is there other primary energy associated with the electricity production in 2008? BALANÇO ENERGÉTICO tep Total de Carvão Total de Petróleo Gás Natural (*) Gases o Outros Derivados Total de Eectricidade Calor Resíduos Industriais Renováveis Sem Hídrica TOTAL GERAL 2008 4 = 1 a 322= 15 + 212330 = 24 a 2936 = 31 a 35373846 = 39 a 45 47=4+22+23+30+36+3 7+38+46 IMPORTAÇÕES1.2 327 21916 608 3844 163 167 923 984 24 022 754 PRODUÇÃO DOMÉSTICA 2. 1 142 338 39 8003 190 6794 372 817 VARIAÇÃO DE "STOCKS" 3.- 223 603 315 673 5 960 - 837 97 193 SAÍDAS 4. 24 9493 680 661 112 918 17 6343 836 162 CONSUMO DE ENERGIA PRIMÁRIA 5.2 525 87312 612 0504 157 207 1 953 404 39 8003 173 88224 462 216 PARA NOVAS FORMAS DE ENERGIA6.2 444 7031 079 1372 597 143 -2 810 996-1 472 450 1 1201 367 3913 206 048 Electricidade 6.62 444 703 475 5711 970 751 -2 325 570 264 4512 829 906 Cogeração 6.7 834 520 626 392 24 379- 485 426-1 472 450 2 523 974 514 504 452 CONSUMO DO SECTOR ENERGÉTICO7. 475 376 56 103 605 301 270 736 31 407 519 CONSUMO COMO MATÉRIA PRIMA 1 275 842 DISPONÍVEL PARA CONSUMO FINAL8. 81 1709 781 6951 503 961 4 159 0991 201 714 38 6801 806 48818 572 807
 Gases o Outros Derivados Total de Eectricidade Calor Resíduos Industriais Renováveis Sem Hídrica TOTAL GERAL = 1 a 322= = 24 a 2936 = 31 a = 39 a 45 47= IMPORTAÇÕES PRODUÇÃO DOMÉSTICA VARIAÇÃO DE STOCKS SAÍDAS CONSUMO DE ENERGIA PRIMÁRIA PARA NOVAS FORMAS DE ENERGIA Electricidade Cogeração CONSUMO DO SECTOR ENERGÉTICO CONSUMO COMO MATÉRIA PRIMA DISPONÍVEL PARA CONSUMO FINAL")
58
BALANÇO ENERGÉTICO tep Total de Carvão Total de Petróleo Gás Natural (*) Gases o Outros Derivados Total de Eectricidade Calor Resíduos Industriais Renováveis Sem Hídrica TOTAL GERAL 2008 4 = 1 a 322= 15 + 212330 = 24 a 2936 = 31 a 35373846 = 39 a 45 47=4+22+23+30+36+3 7+38+46 IMPORTAÇÕES1.2 327 21916 608 3844 163 167 923 984 24 022 754 PRODUÇÃO DOMÉSTICA 2. 1 142 338 39 8003 190 6794 372 817 VARIAÇÃO DE "STOCKS" 3.- 223 603 315 673 5 960 - 837 97 193 SAÍDAS 4. 24 9493 680 661 112 918 17 6343 836 162 CONSUMO DE ENERGIA PRIMÁRIA 5.2 525 87312 612 0504 157 207 1 953 404 39 8003 173 88224 462 216 PARA NOVAS FORMAS DE ENERGIA6.2 444 7031 079 1372 597 143 -2 810 996-1 472 450 1 1201 367 3913 206 048 Electricidade 6.62 444 703 475 5711 970 751 -2 325 570 264 4512 829 906 Cogeração 6.7 834 520 626 392 24 379- 485 426-1 472 450 2 523 974 514 504 452 CONSUMO DO SECTOR ENERGÉTICO7. 475 376 56 103 605 301 270 736 31 407 519 CONSUMO COMO MATÉRIA PRIMA 1 275 842 DISPONÍVEL PARA CONSUMO FINAL8. 81 1709 781 6951 503 961 4 159 0991 201 714 38 6801 806 48818 572 807 Primary Energy used for Electricity Is there other primary energy associated with the electricity production in 2008?

59
Primary Energy used for Electricity What is the primary energy associated with the electricity production in 2008? –Primary energy associated with fuels that produce (only) thermoelectricity is not problematic –Primary energy associated with fuels that produce thermoelectricity & heat is more problematic Why?
 thermoelectricity is not problematic –Primary energy associated with fuels that produce thermoelectricity & heat is more problematic Why .")
60
Primary Energy used for Electricity What is the primary energy associated with the electricity production in 2008? –Primary energy associated with fuels that produce (only) thermoelectricity is not problematic –Primary energy associated with fuels that produce thermoelectricity & heat is more problematic Why? How to split primary energy into primary energy associated with 1) heat production and 2) electricity production?
 thermoelectricity is not problematic –Primary energy associated with fuels that produce thermoelectricity & heat is more problematic Why. How to split primary energy into primary energy associated with 1) heat production and 2) electricity production .")
61
Primary Energy used for Electricity What is the primary energy associated with the electricity production in 2008? –Primary energy associated with fuels that produce (only) thermoelectricity is not problematic –Primary energy associated with fuels that produce thermoelectricity & heat is more problematic The % of primary energy associated with electricity is equal to the % of electricity in the output (roughly 25%) All primary energy is attributed to electricity production
 thermoelectricity is not problematic –Primary energy associated with fuels that produce thermoelectricity & heat is more problematic The % of primary energy associated with electricity is equal to the % of electricity in the output (roughly 25%) All primary energy is attributed to electricity production.")
62
Primary Energy used for Electricity What is the primary energy associated with the electricity production in 2008? –Primary energy associated with fuels that produce (only) thermoelectricity is not problematic –Primary energy associated with fuels that produce thermoelectricity & heat is more problematic The % of primary energy associated with electricity is equal to the % of electricity in the output (roughly 25%) All primary energy is attributed to electricity production –What about primary energy associated with primary renewable electricity? In the PEB: it is just equal to electricity produced
 thermoelectricity is not problematic –Primary energy associated with fuels that produce thermoelectricity & heat is more problematic The % of primary energy associated with electricity is equal to the % of electricity in the output (roughly 25%) All primary energy is attributed to electricity production –What about primary energy associated with primary renewable electricity. In the PEB: it is just equal to electricity produced.")
63
Primary Energy used for Electricity What is the primary energy associated with 1 kWh of (different types) of primary renewable electricity? MethodsWind Electricity PhotovoltaicHydro Electricity Geothermal Electricity electricity producedElectricity (1 kWh)
.")
64
Primary Energy used for Electricity What is the primary energy associated with 1 kWh of (different types) of primary renewable electricity? What would be the method if we were using the concept of Primary Energy? MethodsWind Electricity PhotovoltaicHydro Electricity Geothermal Electricity electricity producedElectricity (1 kWh) measure of fossil energy 0 0 0 0
 measure of fossil energy")
65
Primary Energy used for Electricity What is the primary energy associated with 1 kWh of (different types) of primary renewable electricity? MethodsWind Electricity PhotovoltaicHydro Electricity Geothermal Electricity as it is found in natureKinetic energyRadiationPotential EnergyHeat electricity producedElectricity (1 kWh) measure of fossil energy 0 0 0 0
 measure of fossil energy")
66
Physical Content Method (IEA) The primary energy is the 1 st energy form downstream for which multiple energy uses are pratical Heat (nuclear, geothermal and solar thermal) –Conversion from heat to electricity in geothermal is 10% and in nuclear is 30% Electricity for wind, tide/wave/ocean and solar photovoltaic (100%)
 The primary energy is the 1 st energy form downstream for which multiple energy uses are pratical Heat (nuclear, geothermal and solar thermal) –Conversion from heat to electricity in geothermal is 10% and in nuclear is 30% Electricity for wind, tide/wave/ocean and solar photovoltaic (100%)")
67
Primary Energy used for Electricity What is the primary energy associated with 1 kWh of (different types) of primary renewable electricity? –Physical Content Method: primary energy is the first form of comercial energy available (IEA) MethodsWind Electricity PhotovoltaicHydro Electricity Geothermal Electricity as it is found in natureKinetic energyRadiationPotential EnergyHeat electricity producedElectricity (1 kWh) measure of fossil energy 0 0 0 0 Physical Content MethodElectricity (1 kWh) Heat (1/0.1 kWh)
 MethodsWind Electricity PhotovoltaicHydro Electricity Geothermal Electricity as it is found in natureKinetic energyRadiationPotential EnergyHeat electricity producedElectricity (1 kWh) measure of fossil energy Physical Content MethodElectricity (1 kWh) Heat (1/0.1 kWh).")
68
Partial Substitution Method (EIA) The amount of energy that would be necessary to generate and identical amount of electricity in conventional thermal power plants –Uses an average generating efficiency (40%) to convert electricity to primary energy
 The amount of energy that would be necessary to generate and identical amount of electricity in conventional thermal power plants –Uses an average generating efficiency (40%) to convert electricity to primary energy")
69
Primary Energy used for Electricity What is the primary energy associated with 1 kWh of (different types) of primary renewable electricity? –Physical Content Method: primary energy is the first form of comercial energy available (IEA) –Partial Substitution Method: primary energy is the amount of conventional energy that would have to be used (EIA) MethodsWind Electricity PhotovoltaicHydro Electricity Geothermal Electricity as it is found in natureKinetic energyRadiationPotential EnergyHeat electricity producedElectricity (1 kWh) measure of fossil energy 0 0 0 0 Physical Content MethodElectricity (1 kWh) Heat (1/0.1 kWh) Partial Substitution MethodFuel (1/0.4 kWh)
 –Partial Substitution Method: primary energy is the amount of conventional energy that would have to be used (EIA) MethodsWind Electricity PhotovoltaicHydro Electricity Geothermal Electricity as it is found in natureKinetic energyRadiationPotential EnergyHeat electricity producedElectricity (1 kWh) measure of fossil energy Physical Content MethodElectricity (1 kWh) Heat (1/0.1 kWh) Partial Substitution MethodFuel (1/0.4 kWh).")
70
Renewable Primary Energy What is the primary energy associated with the renewable electricity production in 2008 (toe)? MethodsWind Electricity PhotovoltaicHydro Electricity Geothermal Electricity Portuguese Energetic Balance 495 102 3 268 627 456 16 512 Physical Content Method Partial Substitution Method

71
Renewable Primary Energy What is the primary energy associated with the renewable electricity production in 2008 (toe)? What are the 1) total primary energy consumption & 2) fractions of renewable primary energy MethodsWind Electricity PhotovoltaicHydro Electricity Geothermal Electricity Portuguese Energetic Balance 495 102 3 268 627 456 16 512 Physical Content Method 495 102 3 268 627 456 165 120 Partial Substitution Method 495 102/0.4 3 268/0.4 627 456/0.4 16 512/0.4 MethodsRen. Electricity + Other Ren.TotalFraction of renewables Portuguese Energetic Balance Physical Content Method Partial Substitution Method
 total primary energy consumption & 2) fractions of renewable primary energy MethodsWind Electricity PhotovoltaicHydro Electricity Geothermal Electricity Portuguese Energetic Balance Physical Content Method Partial Substitution Method / / / /0.4 MethodsRen. Electricity + Other Ren.TotalFraction of renewables Portuguese Energetic Balance Physical Content Method Partial Substitution Method.")
72
Total primary energy consumption & renewable primary energy consumption? BALANÇO ENERGÉTICO tep Total de Carvão Total de Petróleo Gás Natural (*) Total de Eectricidade Calor Resíduos Industriais Renováveis Sem Hídrica TOTAL GERAL 2008 4 = 1 a 322= 15 + 2123 36 = 31 a 35 3738 46 = 39 a 45 47=4+22+23+ 30+36+37+38 +46 IMPORTAÇÕES 1.2 327 21916 608 3844 163 167 923 984 24 022 754 PRODUÇÃO DOMÉSTICA 2. 1 142 338 39 8003 190 6794 372 817 VARIAÇÃO DE "STOCKS" 3.- 223 603 315 673 5 960 - 837 97 193 SAÍDAS 4. 24 9493 680 661 112 918 17 6343 836 162 CONSUMO DE ENERGIA PRIMÁRIA 5.2 525 87312 612 0504 157 2071 953 404 39 8003 173 88224 462 216 PARA NOVAS FORMAS DE ENERGIA 6.2 444 7031 079 1372 597 143-2 810 996-1 472 450 1 1201 367 3913 206 048 Electricidade 6.62 444 703 475 5711 970 751-2 325 570 264 4512 829 906 Cogeração 6.7 834 520 626 392- 485 426-1 472 450 2 523 974 514 504 452 CONSUMO DO SECTOR ENERGÉTICO 7. 475 376 56 103 605 301 270 736 31 407 519 CONSUMO COMO MATÉRIA PRIMA 1 275 842 DISPONÍVEL PARA CONSUMO FINAL 8. 81 1709 781 6951 503 9614 159 0991 201 714 38 6801 806 48818 572 807
 Total de Eectricidade Calor Resíduos Industriais Renováveis Sem Hídrica TOTAL GERAL = 1 a 322= = 31 a = 39 a 45 47= IMPORTAÇÕES PRODUÇÃO DOMÉSTICA VARIAÇÃO DE STOCKS SAÍDAS CONSUMO DE ENERGIA PRIMÁRIA PARA NOVAS FORMAS DE ENERGIA Electricidade Cogeração CONSUMO DO SECTOR ENERGÉTICO CONSUMO COMO MATÉRIA PRIMA DISPONÍVEL PARA CONSUMO FINAL")
73
Total primary energy consumption & renewable primary energy consumption? BALANÇO ENERGÉTICO tep Total de Carvão Total de Petróleo Gás Natural (*) Total de Eectricidade Calor Resíduos Industriais Renováveis Sem Hídrica TOTAL GERAL 2008 4 = 1 a 322= 15 + 2123 36 = 31 a 35 3738 46 = 39 a 45 47=4+22+23+ 30+36+37+38 +46 IMPORTAÇÕES 1.2 327 21916 608 3844 163 167 923 984 24 022 754 PRODUÇÃO DOMÉSTICA 2. 1 142 338 39 8003 190 6794 372 817 VARIAÇÃO DE "STOCKS" 3.- 223 603 315 673 5 960 - 837 97 193 SAÍDAS 4. 24 9493 680 661 112 918 17 6343 836 162 CONSUMO DE ENERGIA PRIMÁRIA 5.2 525 87312 612 0504 157 2071 953 404 39 8003 173 88224 462 216 PARA NOVAS FORMAS DE ENERGIA 6.2 444 7031 079 1372 597 143-2 810 996-1 472 450 1 1201 367 3913 206 048 Electricidade 6.62 444 703 475 5711 970 751-2 325 570 264 4512 829 906 Cogeração 6.7 834 520 626 392- 485 426-1 472 450 2 523 974 514 504 452 CONSUMO DO SECTOR ENERGÉTICO 7. 475 376 56 103 605 301 270 736 31 407 519 CONSUMO COMO MATÉRIA PRIMA 1 275 842 DISPONÍVEL PARA CONSUMO FINAL 8. 81 1709 781 6951 503 9614 159 0991 201 714 38 6801 806 48818 572 807
 Total de Eectricidade Calor Resíduos Industriais Renováveis Sem Hídrica TOTAL GERAL = 1 a 322= = 31 a = 39 a 45 47= IMPORTAÇÕES PRODUÇÃO DOMÉSTICA VARIAÇÃO DE STOCKS SAÍDAS CONSUMO DE ENERGIA PRIMÁRIA PARA NOVAS FORMAS DE ENERGIA Electricidade Cogeração CONSUMO DO SECTOR ENERGÉTICO CONSUMO COMO MATÉRIA PRIMA DISPONÍVEL PARA CONSUMO FINAL")
74
Renewable Primary Energy What is the primary energy associated with the renewable electricity production in 2008 (toe)? What are the 1) total primary energy consumption & 2) fractions of renewable primary energy MethodsWind Electricity PhotovoltaicHydro Electricity Geothermal Electricity Portuguese Energetic Balance 495 102 3 268 627 456 16 512 Physical Content Method 495 102 3 268 627 456 165 120 Partial Substitution Method 495 102/0.4 3 268/0.4 627 456/0.4 16 512/0.4 MethodsRen. Electricity + Other Ren.TotalFraction of renewables Portuguese Energetic Balance 43162202446221617.6% Physical Content Method 44648282461082418.1% Partial Substitution Method 60297272617572323%
 total primary energy consumption & 2) fractions of renewable primary energy MethodsWind Electricity PhotovoltaicHydro Electricity Geothermal Electricity Portuguese Energetic Balance Physical Content Method Partial Substitution Method / / / /0.4 MethodsRen. Electricity + Other Ren.TotalFraction of renewables Portuguese Energetic Balance % Physical Content Method % Partial Substitution Method %.")
75
Comparison of Methods Neither the Physical Content Method nor the Partial Substitution Methods are a measure of primary fossil energy Growth of wind, hydro or solar to produce electricity leads to energy savings with the Physical Content Method

76
Comparison of Methods Energy intensity (energy use per unit of GDP): –What is the meaning of the indicator?
: –What is the meaning of the indicator")
77
Comparison of Methods Energy intensity (energy use per unit of GDP): –A measure of the efficiency of a country in using energy –Low values correspond to environmental and economic advantages What happens to this indicator if a country that only uses electricity as final energy changes from only using coal as primary energy to only using hydro? –With the partial substitution method? –With the physical content method?

78
Primary Energy Valuation Methods Physical Content Method Cegonho, 2011

79
Primary Energy Valuation Methods Partial Substitution Method Nominal efficiency is the yearly efficiency of fossil fuel power plants Cegonho, 2011

80
Primary Energy Valuation Methods BP Substitution Method Nominal efficiency is 38 % (typical of a fossil fuel power plant) Cegonho, 2011
 Cegonho, 2011")
81
Primary Energy Valuation Methods NL Substitution Method Nominal efficiency is the yearly efficiency of fossil fuel and nuclear power plants Cegonho, 2011

Apresentações semelhantes


 – Lápides 1, 2, 3» «nomes gravados, 21 de Agosto de 2008» «Ultramar.TerraWeb»>")


. Nenhuns direitos reservados, excepto para fins comerciais. Por favor, não coloque.>")

 Rector of University.>")


