Carregar apresentação
A apresentação está carregando. Por favor, espere

5
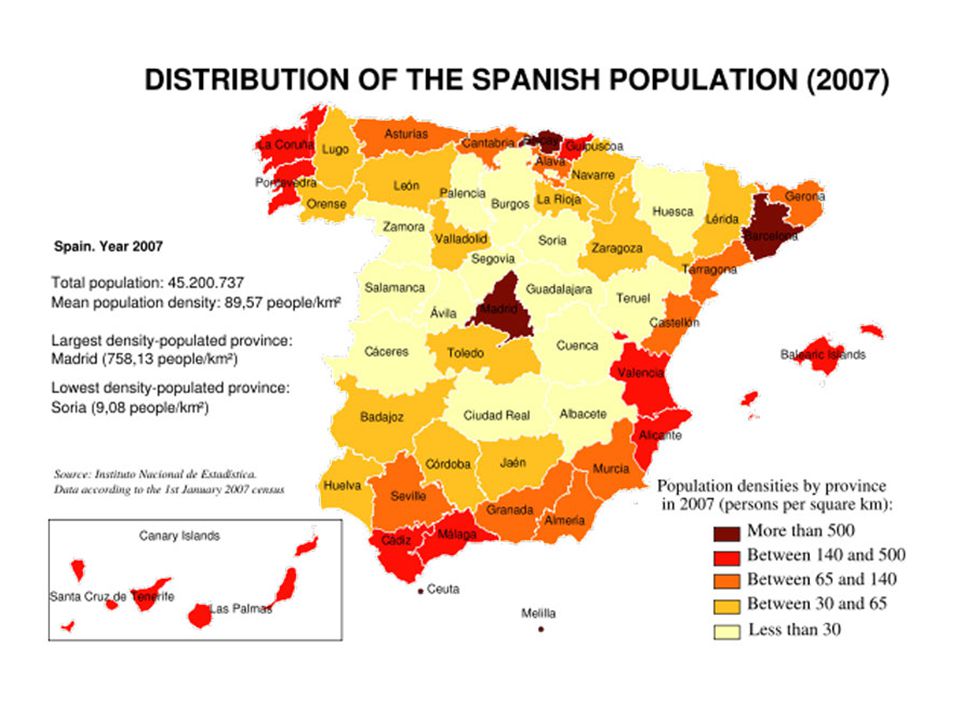
Where are the most populated places in Spain? Can you suggest reasons for this? Look at the atlas pages 44-45 what is the difference in the climate between these more and less populated places? Why would this make a difference? Can you think of any other reasons

7
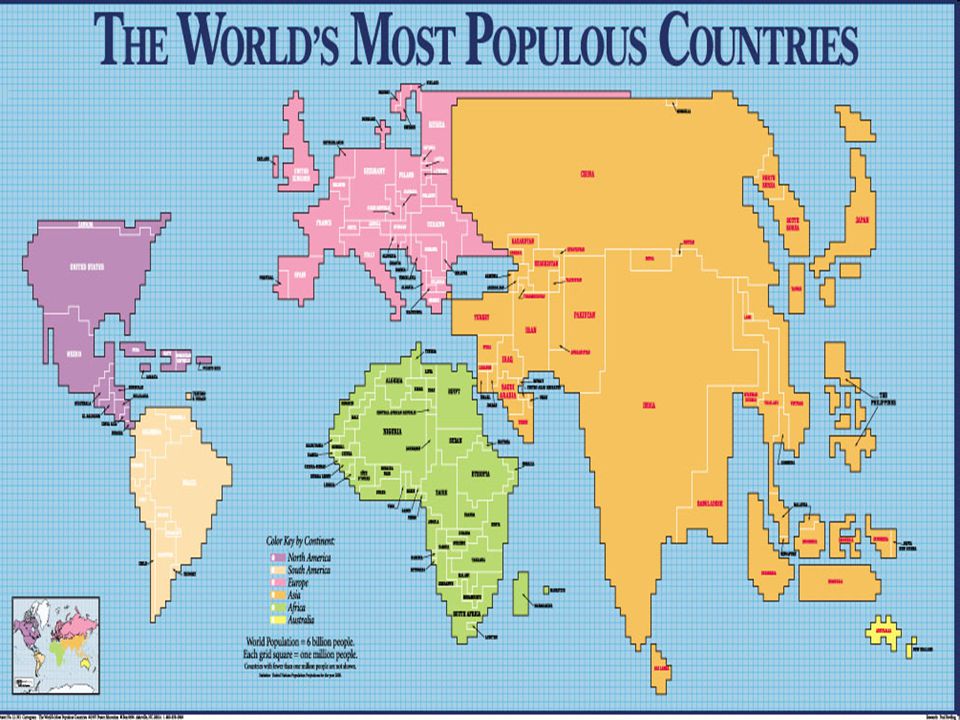
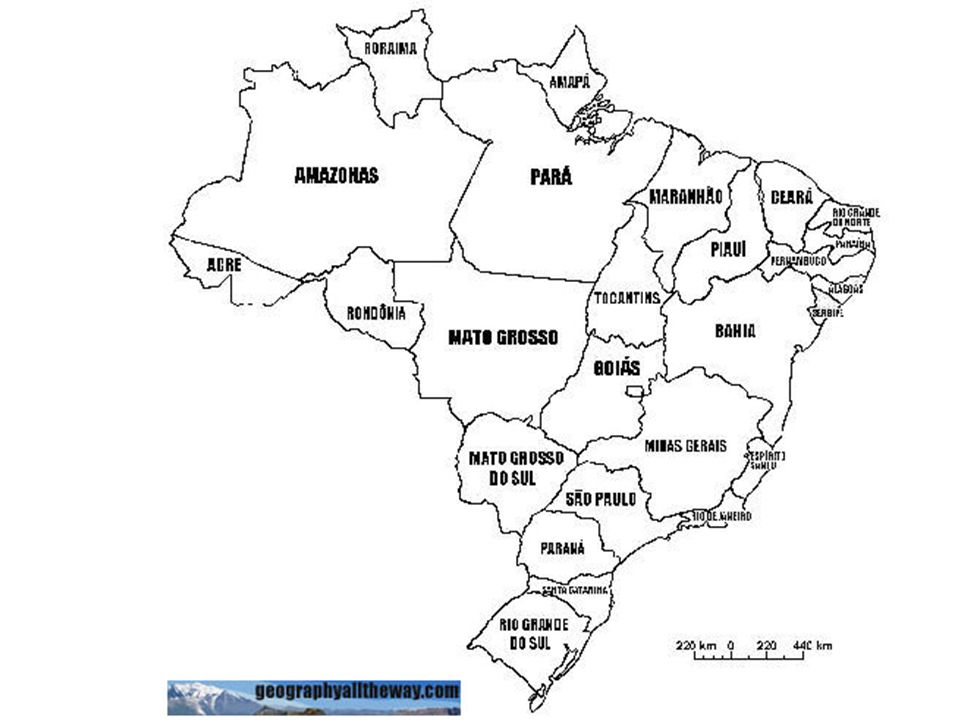
How can we present Population Density? LEARNING OBJECTIVE 1.To identify the different ways of displaying population data 2.To construct a Choropleth map to show the Population density of Brazil

10
Dot Map

11
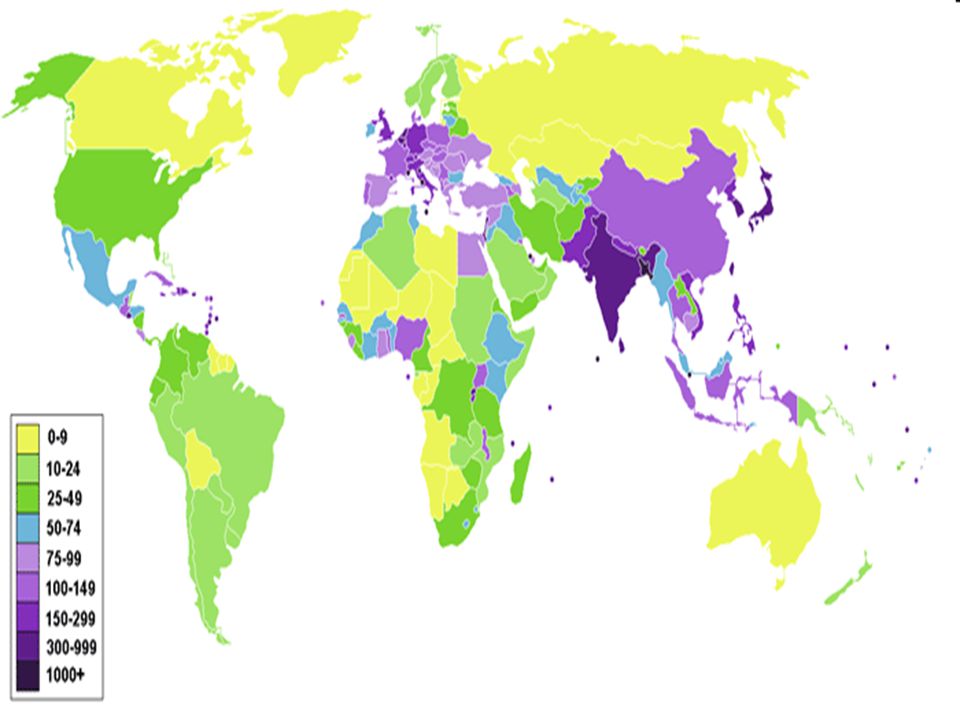
Choropleth Map

12
Rules of Choropleth Maps Equal sized divisions between the categories Same colour throughout Highest number is the darkest shade Lowest number is the lightest shade

13
Task Using the data create a choropleth map to show the population density of Brazil

15
StateGDP per Capita ($)PopulationArea (km²)Density (people/km²) Brasilia905518000005814310 Rio De Janeiro53001340000043920305 São Paulo739034100000248809137 Alagoas161526000002793393 Pernambuco236474000009893775 Sergipe288316300002199474 Espίrito Santo385728000004618461 Paraίba151533000005658458 Santa Catarina459249000009544351 Rio Grande Do Norte239026000005360249 Ceará1838680000014681746 Paraná5092900000019970945 Rio Grande Do Sul5208960000028206234 Minas Gerais37721670000058838328 Bahia24721254000056729522 Maranhão1379522000035423015 Goiás3325451000034128513 Piauί1148270000025237811 Mato Grosso Do Sul479019000003581595 Rondônia283312000002385135 Pará2667551000012523834 Tocantins133310500002922054 Acre34504830001531503 Amapá22433789001434543 Mato Grosso336322300009014202 Amazonas3320250000015778202 Roraima30272477002252041
PopulationArea (km²)Density (people/km²) Brasilia Rio De Janeiro São Paulo Alagoas Pernambuco Sergipe Espίrito Santo Paraίba Santa Catarina Rio Grande Do Norte Ceará Paraná Rio Grande Do Sul Minas Gerais Bahia Maranhão Goiás Piauί Mato Grosso Do Sul Rondônia Pará Tocantins Acre Amapá Mato Grosso Amazonas Roraima")
16
>100 81 - 100 61 - 80 41 - 60 21 - 40 0 - 20

17
StateDensity (people/km²) Brasilia310 Rio De Janeiro305 São Paulo137 Alagoas93 Pernambuco75 Sergipe74 Espίrito Santo61 Paraίba58 Santa Catarina51 Rio Grande Do Norte49 Ceará46 Paraná45 Rio Grande Do Sul34 Minas Gerais28 Bahia22 Maranhão15 Goiás13 Piauί11 Mato Grosso Do Sul5 Rondônia5 Pará4 Tocantins4 Acre3 Amapá3 Mato Grosso2 Amazonas2 Roraima1
 Brasilia310 Rio De Janeiro305 São Paulo137 Alagoas93 Pernambuco75 Sergipe74 Espίrito Santo61 Paraίba58 Santa Catarina51 Rio Grande Do Norte49 Ceará46 Paraná45 Rio Grande Do Sul34 Minas Gerais28 Bahia22 Maranhão15 Goiás13 Piauί11 Mato Grosso Do Sul5 Rondônia5 Pará4 Tocantins4 Acre3 Amapá3 Mato Grosso2 Amazonas2 Roraima1")
19
Task 2 Annotate your map to explain the population distribution of Brazil.

20
Describing…. Describe the population density of Brazil. Are there any problems with presenting data in this way?

21
Homework: Cut out the cards about why people choose to live in particular places On each one write a reason why this is important On the back of each card add a picture to show an example of somewhere that does or does not have this feature

22
Homework: Cut out the cards about why people choose to live in particular places On each one write a reason why this is important On the back of each card add a picture to show an example of somewhere that does or does not have this feature

Apresentações semelhantes


Density (people/km²) Acre4830001531503 Amazonas250000015778202 Roraima2477002252041 Rondônia12000002385135 Amapá3789001434543.>")

. O modelo SLII propõe que há quatro níveis de desenvolvimento pelos quais uma pessoa que aprende algo passa, e não importa.>")


