Carregar apresentação
A apresentação está carregando. Por favor, espere

1
Air Quality Monitoring Network

2
2 General info. The network has been operating for eight years. It was officially inaugurated on May 31, 1994. The implementation of this network was part of two conditions that the CEPRAM (State Council for the Environment) established in its resolution 620 on July 21, 1992, as a result of the analysis of the Environmental Impact Assessment Study for the expansion of the number of companies installed in the Pole. CETREL developed the project, and carried out the installation and operation of the network because of its previous environmental protection activities in the area, such as waste treatment, and disposal of hazardous wastes.
 established in its resolution 620 on July 21, 1992, as a result of the analysis of the Environmental Impact Assessment Study for the expansion of the number of companies installed in the Pole. CETREL developed the project, and carried out the installation and operation of the network because of its previous environmental protection activities in the area, such as waste treatment, and disposal of hazardous wastes..")
3
3 What parameters are measured? Conventional Pollutants: Particulate matter (Hi-Vol and PM10), sulfur dioxide, nitrogen oxides (NO e NO 2 ), CO and O 3, which are regulated under CONAMA standards from 03/1990. Non conventional pollutants: VOC’s regulated under CEPRAM resolution 2878 of 2001, and metals (Pb, Cr, Cu, Fe, Ni, As, and Hg). Meteorological parameters: wind velocity and direction, temperature, humidity, pluviometric precipitation, solar radiation and pressure. There is an Acoustic radar that measures meteorological parameters in the higher layers of the atmosphere for the surroundings of Cetrel.
, sulfur dioxide, nitrogen oxides (NO e NO 2 ), CO and O 3, which are regulated under CONAMA standards from 03/1990. Non conventional pollutants: VOC’s regulated under CEPRAM resolution 2878 of 2001, and metals (Pb, Cr, Cu, Fe, Ni, As, and Hg). Meteorological parameters: wind velocity and direction, temperature, humidity, pluviometric precipitation, solar radiation and pressure. There is an Acoustic radar that measures meteorological parameters in the higher layers of the atmosphere for the surroundings of Cetrel..")
4
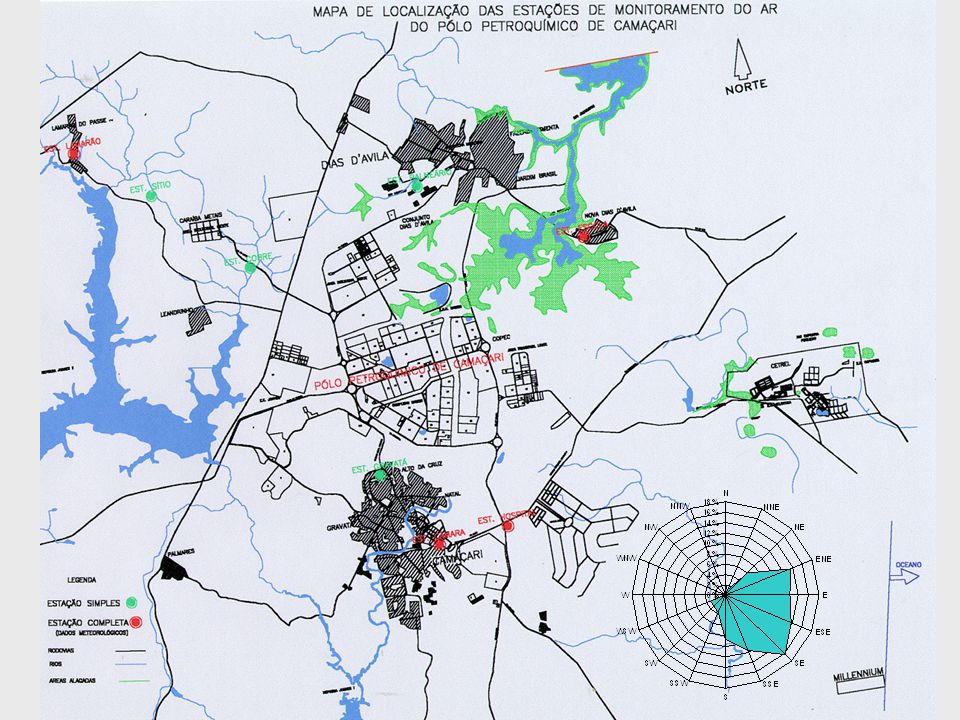
4 Location of the stations and parameters measured

5
5 Meteorological Parameter Stations.

6
Pólo RLAM SALVADOR LEGEND - Air monitoring stations.

8
8 Air Quality Monitoring Station

9
9 Analytical Methods SO 2 – UV fluorescence – continuous and automatic. NO X – Chemoluminescence – continuous and automatic- O 3 – UV Photometry - continuous and automatic. CO – Infrared associated to correlation filters. Continuous and automatic. VOC’s- GC and cryogenic trap for inlet; Sampling every 15 days, for 24h. The samples are collected in special recipients called SUMMA CANISTERS, and injected into GC by a cryogenic concentrator. Particulate Matter: HI-VOL or High Volume Sampler, sampling every 6 days for 24 h. PM10 – This is similar to HI-VOL but it is destined for particles smaller than 10 m

10
10 VOC’s

11
VOC’s monitoring

12
12 Objectives of Air Quality Monitoring The main objectives of air monitoring are: –To evaluate the quality of air in accordance with the requirements that CONAMA and CEPRAM established for the protection of densely populated areas in Brazil (Camaçari, Dias D'Ávila e Lamarão do Passe). –To guide the companies in lowering or maintaining their emission levels through adjustment of their processes, changes in their raw materials, or by installing pollution control equipment, etc. –To evaluate the efficiency of the corrective measures that are implemented.

13
13 Resources The network was set up and installed using R$2 million for purchase of equipment and for the startup. This was carried out using funds from companies from the Polo. This was done by a small loan by BNDES. The yearly operational cost is covered by the companies of the Polo too. The yearly operational cost is divided between all the companies that are involved. The cost is shared proportionally to the emissions of each companies and the investments that were involved in measuring each pollutant. The budget is discussed each September, and it must be approved by all of the companies that are involved. All companies in the Polo participate in covering the costs. Even the companies that do not emit significant loads must pay 0.25% of the costs of monitoring.

14
14 2001 Results. 2001 was year with little rain, and relatively good for removal of atmospheric pollutants, mainly in June, July, August and September. The inquiry will have to be supported on automatic and continuous measurements compared to physical-mathematical models for dispersion of pollutants, through statistical analysis. These models will allow to calculate the concentrations of pollutants in any location and time, including places where measurement is not possible. The RMA of the Pole has some experience in this, but they want to increase their proficiency in these matters. Some research has been done using the model ISCST-3 (Industrial Source Complex Short Term) as is shown in the Appendix.
 as is shown in the Appendix..")
15
15 Sulfur dioxide - SO 2 Wind speed has decreased in relation to previous years for the Lamarao Station, especially for the third trimester, and to a lesser extent in the second semester. This has caused a small increase of the concentration of SO 2 in the Small farm and Lamarao Stations, and to a lesser degree in the Cobre Station. The Hospital Station has also shown a slight rise in the concentrations of SO 2 from May to November, or in other words, the hottest months of the year, which are the worst for dispersion of pollutants. For 2001 the load of SO 2 increased due to an increase of the emissions by Acrinor, also apparent in the air quality of this station.

16
16 Monthy averages of SO 2

17
17 The graph shows that the annual average has decreased from 2000 to 2001. Annual Average for SO 2 - 1995 to 2001

18
18 Ozone - O 3 (I) The ozone level exceeded the 1h standard of 81.6 ppb set by CONAMA on 25 occasions. 6 of these violations occurred on the same day. In terms of wind directions and speeds, there is no predominant direction. Moreover, wind has been detected from many directions, which allows some speculation where ozone precursors come from. –From the city of Salvador when the wind blows South, Southeast and East. –From the Landulpho Refinery when the wind blows W and SW. –The highways close to Camaçari, mainly BR 324, when the wind blows N. –In the case of the Cobre Station, since the winds come from NE, it is impossible to infer on the ozone precursor sources.

19
19 Ozone - O 3 (II) From a meteorological standpoint, the trajectories of the precursors are not always straight. The great part of the events are observed in the morning, suggesting that ozone is carried over from the previous day. To understand these processes better more info is necessary regarding the precursors of ozone, in particular an inventory of the precursors, and the use of a photochemical model with dispersion and meteorological conditions coupled to it would be useful. Comparing the results for Ozone from 1995 to 2001, we observe that higher concentrations were present when other pollutants (SO2, CO and NO2). There was an increase of the ozone concentrations for 2001, probably due to the increase of production of companies in the POLO, which leads an increase in fuel consumption. Control of these emissions will be necessary to prevent further deterioration of the air quality in the area under the influence of the POLO
. There was an increase of the ozone concentrations for 2001, probably due to the increase of production of companies in the POLO, which leads an increase in fuel consumption. Control of these emissions will be necessary to prevent further deterioration of the air quality in the area under the influence of the POLO.")
20
20 Ozone - O 3

21
21 Carbon Monoxide-CO CO concentration for the Hospital station has also increased in comparison to the previous year. The maximum CO concentrations were below the 35 ppm 1h standard. The concentration peak was in May, as was the previous year.

22
22 Nitrogen dioxide - NO 2 The Hospital and Laramao stations have had different trends than the previous years, in particular in the second and third semester, where they are both above concentrations of the previous years.

23
23 Meteorological Parameters The meteorological parameters followed the same pattern of the last two years.

24
24 Meteorological Parameters.

25
25 Particulate Matter: HI-VOL There was a reduction of the year particulate matter average from 2000 to 2001. The monthly geometric average of rainfall in 2001 was one of the lowest in seven year, especially for April, May, June and November, where higher monthly averages of particulate matter are apparent.

26
26 Particulate Matter: PM10 The analysis of monthly behaviour shows a significant increase in the PM10 concentration in the first filve months of 2001, in relation to the previous years.

27
27 Occurrence of COV’s in the POLO area Number of samples in 2000=91. Número total de amostragens em 2000 = 91

28
28 Conclusions The air quality has decreased in the past 6 years. –For Camacari, from 2000 to 2002, comparing SO 2 vs the wind direction, it is observed that wind direction was very important in the formation of pollution episodes. –É preciso um maior acompanhamento dos ventos por parte das empresas do Pólo, para minimizar as emissões nos níveis críticos, de que os ventos se dirigirem ao pólo, para Camaçari.

29
29 Conclusions Emissions control is suggested. Expansion of the monitoring network is also recommended. Recomenda-se um maior controle destas emissões, e expandir a RMA, conforme a tabela de reavaliação. Bem como, manter direção e velocidade do vento em todas as outras estações da RMA, inclusive na nova estação de Leandrinho. Pollution prevention can be achieved using a model that predicts pollution with 6-72h.. This could be achieved using MM5.

30
30 Publication of Results The results can be sent monthly to the companies of the Pole, and to other interested parties. Some companies can request forecasting for daily episodes.

31
31

32
32 Comentários Finais A Rede encontra-se instalada e em operação rotineira desde Maio/94. Os resultados obtidos até o momento estão dentro dos padrões CONAMA 003/94, exceto para o ozônio e SO2, que tem em algumas ocasiões ultrapassado os padrão do CONAMA 003/90. A carga de poluentes emitidas pelas empresas é checada periodicamente. Um dos objetivos principais da rede é orientar as empresas no sentido de reduzir as cargas. Os dados gerados pela rede são enviados para as empresas do Pólo mensalmente. A análise mensal dos parâmetros meteorológicos permitiu a identificação do período mais crítico para dispersão atmosférica, que engloba os meses de maio a setembro, períodos semelhantes ao longo dos anos de operação da Rede.

33
33 Comentários Finais De um modo geral essa análise mostrou que a circulação local do vento de superfície modifica a sua direção e a velocidade sobre a região de influência do Pólo, em função da topografia e das alterações no ciclo climatológico sazonal da atmosfera; A qualidade do ar tem sido classificada como "boa", desde 1994, ou seja, a concentração dos poluentes tem se mantido sempre abaixo dos padrões estabelecidos pelo CONAMA 003/90, para os poluentes, SO2, CO, NO2 e MP. Entretanto o SO2 apresentou picos de concentração bastante elevados em algumas ocasiões. Com relação aos compostos orgânicos voláteis, poluentes não legislados no país, detectou-se que a concentração de alguns destes poluentes, tende a se elevar no período entre abril a setembro, devido as condições meteorológicas desfavoráveis à dispersão;

34
34 Comentários Finais À partir de 1996 foi intensificado o monitoramento de poluentes orgânicos na área de influência do Pólo. Embora a medição dos parâmetros meteorológicos, no nível da superfície horizontal, seja bastante representativa do comportamento do regime microclimático local, em 1997 foi adquirido um radar acústico, com o objetivo de efetuar medições do perfil vertical do vento, e da altura da camada de mistura, para melhor interpretar os resultados obtidos através da Rede de monitoramento do ar. Observa-se ainda que o vento muda de direção com a altura, principalmente no regime de microescala em zona costeira.

Apresentações semelhantes


: (based on and the message from INPAs General Director, Dr Adalberto Val, and on former.>")


 SEGUNDO NOVOS ESTRATOS VITÓRIA, ES – OUTUBRO 2008 Kenneth Camargo – IMS/UERJ Cláudia Medina – IESC/UFRJ.>")


