Carregar apresentação
1
GIS: conceitos básicos
Renato Assunção Depto. de Estatística - UFMG

2
Definição de GIS Um Sistema Geográfico de Informação (SIG ou GIS, em inglês) é um conjunto de instrumentos computacionais que permitem ao analista: modificar, visualizar, pesquisar (consultar) e analisar dados geográficos e de planilha.
 e analisar. dados geográficos e de planilha.")
3
Sistema Geográfico de Informação
Software de visualização incluem: Mapinfo, ArcView, Geomedia, AtlasGIS e outros Já lançado: TerraView (gratuito e brasileiro, feito pelo INPE em parceria com várias instituições, incluindo o LESTE/UFMG Software Profissionais incluem ArcInfo, Intergraph SPRING / TERRALIB (gratuito e brasileiro, feito pelo INPE) Componentes de um GIS incluem funcionalidades para Representação de dados Operações Geográficas Mapeamento e Visualização
 Componentes de um GIS incluem funcionalidades para. Representação de dados. Operações Geográficas. Mapeamento e Visualização.")
4
MAPINFO

6
Conceitos Básicos de GIS: Pontos, Linhas e Áreas/Polígonos
Local de crime Posto de gasolina Linha Rua, Rio Polígono/Área Bairro Distrito Policial Slide Purpose: This slide begins the discussion about the basic concepts of GIS: how objects that exist in the real world end up being symbolized on a map, the organization of features into layers, and the link between attribute data and attributes. Discussion Points: Real world features are symbolized on a map. Points are features defined by a single coordinate, a crime incident for example. Lines are defined by connecting a series of points, a street for example. Finally, polygons are closed areas formed by one or more lines, a police beat for example. Instructor Notes: Knowledge of the terminology is essential to further discussion about GIS, so take as much time as necessary to be sure everyone is following along. Questions for Students: Ask the class for real-world examples of points, lines and areas. If they are stumped, ask them to visualize a road map. Examples: Point: Crimes, Parks, Schools, Hospitals, Business Locations Line: Streets, Rivers, Power Lines, Trails Areas: Police Beat, City Limit, Neighborhoods, Gang Territory, Drug Markets Ponto Linha Área

7
Conceitos Básicos de GIS: Como funciona um GIS ?
Informação sobre sua comunidade entra em um GIS como “camadas” Cada camada representa dados de uma mesmo tipo Todos os atributos dos dados para cada aspecto é armazenado no GIS Crimes Ruas Estruturas Uso do Solo Slide Purpose: This slide illustrates how information about a given area is collected and entered into a GIS. Discussion Points: Be sure that students understand that the key with GIS is the link between the computer map and the database associated with it -- or, the informational database with the associated digital map elements. It is important to point out that not everything is included in the GIS. Decisions must be made about which data will be incorporated and how much detail will be included. Focus on the data within a GIS. Data are organized into layers, each one representing a similar type of data. For example, one layer may be streets. The digital map of streets is linked to information about them. The linked database may include information about how many lanes of traffic a given street has, the name of the street, or address ranges. The type of information that is included depends upon decisions that people made when the databases were developed. Another example of a GIS layer is offenses, which along with the address location may include information on date, time of day, type of place, business name, among others.

8
**NOTE: This slide is animated.
Conceitos Básicos de GIS: Sobrepondo Dados (ou camadas) Crimes Ruas Av. Amazonas **NOTE: This slide is animated. Slide Purpose: This slide will illustrate to students that once the layers of data are in the GIS, they can be combined in any number of ways. Discussion Points: Data contained in a GIS can be combined in a number of ways. For instance, if you were interested in seeing if there were a high number of robberies along a major road, streets and robbery information would be the most relevant layers to use in order to answer this question. Even though mapping the data or querying the database can show interesting patterns, a GIS is much more than that. As you saw earlier, a key function of a GIS is the ability to perform analysis. For example, these layers could also be combined in such a way that you could determine exactly how many crimes occurred within a specified distance of Main Street. You could map the results or generate a report that lists the crimes with all of the associated information. Imagine for a moment the complexity of trying to solve this problem if you only had the address files in a regular database. Consider that a robbery that occurred on a side-street would not be listed as being located on Main Street. Without a GIS, searches of this nature are and have been conducted by generating reports from the census tract or district/beat. The information is often too broad to provide a picture of a local area. Another example that remedies this problem would be examining drug offenses within 500 feet of a school (Radial Analysis). Qualquer combinação destas camadas pode ser analisada ou mapeada.
 Crimes. Ruas. Av. Amazonas. **NOTE: This slide is animated. Slide Purpose: This slide will illustrate to students that once the layers of data are in the GIS, they can be combined in any number of ways. Discussion Points: Data contained in a GIS can be combined in a number of ways. For instance, if you were interested in seeing if there were a high number of robberies along a major road, streets and robbery information would be the most relevant layers to use in order to answer this question. Even though mapping the data or querying the database can show interesting patterns, a GIS is much more than that. As you saw earlier, a key function of a GIS is the ability to perform analysis. For example, these layers could also be combined in such a way that you could determine exactly how many crimes occurred within a specified distance of Main Street. You could map the results or generate a report that lists the crimes with all of the associated information. Imagine for a moment the complexity of trying to solve this problem if you only had the address files in a regular database. Consider that a robbery that occurred on a side-street would not be listed as being located on Main Street. Without a GIS, searches of this nature are and have been conducted by generating reports from the census tract or district/beat. The information is often too broad to provide a picture of a local area. Another example that remedies this problem would be examining drug offenses within 500 feet of a school (Radial Analysis). Qualquer combinação destas camadas pode ser analisada ou mapeada.")
9
Representação de Geo-Objetos - 1
Geo-Objetos pontuais: uma localização discreta, usualmente exibida por um símbolo ou rótulo. As posições geográficas de crimes, de acidentes de trânsito, sinais de trânsito, e até mesmo edifícios podem ser representados por dados pontuais. Posto Policial Homicídios

10
Atributos e Localizações, Pontos
Tipo Crime Endereço Data Hora nd Roubo Rua A, 999 St 22 Maio, 22:00 Av Amazonas 1997 Roubo Av Amaz, 830 15, Maio 20:30 1997 Roubo Rua B, 100 29, Maio 15:00 1997 **NOTE: This slide is animated. Slide Purpose: The next three slides illustrate how the three types of data (point, line, and polygon) can be represented on a map, and most importantly, how there is information behind the features displayed on the map by GIS. Discussion Points: With a GIS, you can choose a record from your database and the GIS can show where it is on the map. The entire set of information is linked to the point on the map. A group of records could also be selected from the database and mapped. This could be accomplished by either individually selecting records or querying the database for those that are of interest. For example, you could select all of the Crime Types that are Robberies and have the GIS map those. Point out that while this example uses robberies and auto thefts, you could select any type of crime that is included in the database. It is important that students understand that the only information that can be displayed on a map is the information that has been entered into the GIS. For example, if the victim’s name is not entered from the police report into the GIS database, then that information will not appear. Roubo Av Amaz, 1000 13, Set 22:45 1997 Furto/Veículo Av Amaz, 997 3 Junho 23:00 1997 A base de dados pode ser pesquisada para encontrar onde no mapa ocorreram os roubos
 can be represented on a map, and most importantly, how there is information behind the features displayed on the map by GIS. Discussion Points: With a GIS, you can choose a record from your database and the GIS can show where it is on the map. The entire set of information is linked to the point on the map. A group of records could also be selected from the database and mapped. This could be accomplished by either individually selecting records or querying the database for those that are of interest. For example, you could select all of the Crime Types that are Robberies and have the GIS map those. Point out that while this example uses robberies and auto thefts, you could select any type of crime that is included in the database. It is important that students understand that the only information that can be displayed on a map is the information that has been entered into the GIS. For example, if the victim’s name is not entered from the police report into the GIS database, then that information will not appear. Roubo. Av Amaz, , Set. 22: Furto/Veículo. Av Amaz, Junho. 23: A base de dados pode ser pesquisada para encontrar onde no mapa ocorreram os roubos.")
11
Representação de Geo-Objetos - 2
Geo-objetos de linha: aspectos geográficos que podem ser representados por uma linha ou um conjunto de linhas. A rede de ruas e avenidas numa cidade, as linhas de força elétrica, as rodovias ligando cidades, etc.

12
Atributos e Localizações, Linhas
Faixa de endereço Num. Mão rua Rua Faixas Alagoas 4 Dupla Alagoas 4 Dupla Alagoas 4 Única Goiás 2 Ùnica **NOTE: This slide is animated. Discussion Points: Just like point data, line features can be selected from the table and then mapped. Or, a line can be selected on a map to find out the information about that line in the GIS database. Provide students with an example. For instance, a particular road segment can be queried to find out if a traffic light is present, or the number of lanes in that particular segment. Bahia 2 Única Como dados de pontos, aspectos lineares podem ser selecionados da tabela e mapeados.

13
Representação de Geo-objetos - 3
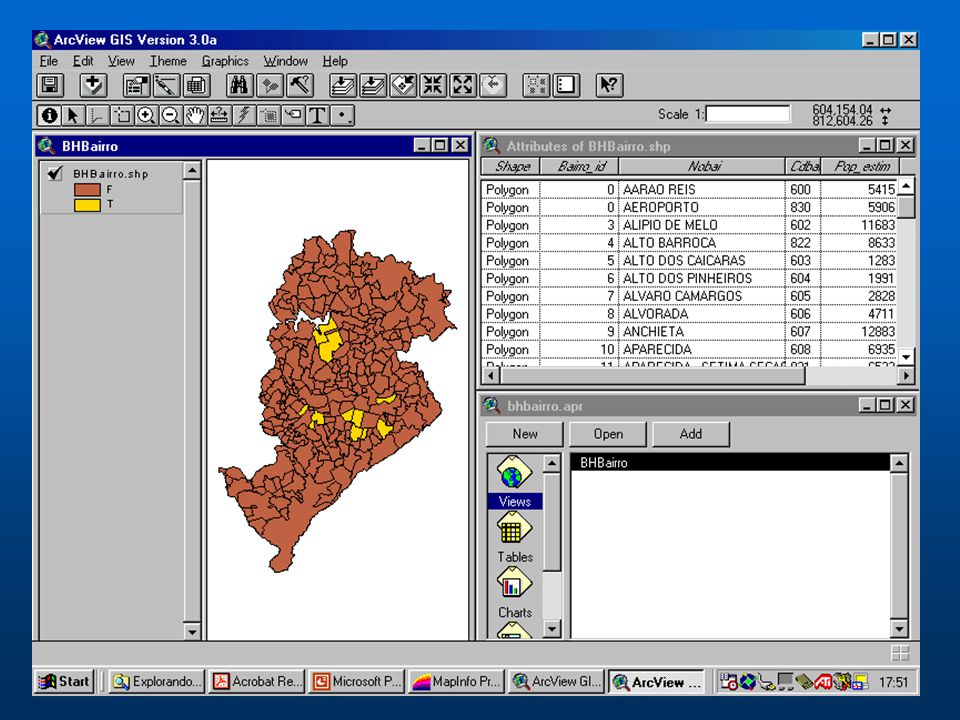
Geo-objetos de polígonos: uma figura de vários lados representada por uma conjunto fechado de linhas. Áreas de patrulhamento, distritos policiais, fronteiras municipais, etc Bairros e distritos de Belo Horizonte

14
Atributos e Localizações, Áreas
Roubos Janeiro % Renda < 1000 Bairro População Alípio de Melo 8,002 56 20 Sacramento Pe. Eustáquio 10,156 67 11 Venda Nova 4,369 150 24 Sta Teresa Alípio de Melo **NOTE: This slide is animated. Slide Purpose: Just as with point and linear features, a record describing an area can be selected from the table and then mapped. The map can also be queried. Como no caso de pontos e linhas, um ou mais registros descrevendo áreas podem ser selecionados de uma tabela e mapeados

15
Representação de Geo-objetos - 4
Geo-objetos de imagens: Fotos verticais de uma área tiradas de um avião ou satélite. Digitalizada e colocada no sistema de coordenadas de um GIS.

16
RELEMBRANDO: Dados gráficos identificam os objetos geográficos; Dados não-gráficos ficam numa tabela (ou planilha) associada de atributos Seus atributos estão nesta linha da planilha; colunas são características da área tais como infra-estrutura, população, números de crimes, etc. Geo-Objeto poligonal

17
Fonte: INPE

18
Sobreposição de mapas: uma séries de mapas empilhados.
Cada um deles mostra um aspecto da realidade tal como topografia, tipo de solo, rodovias, rios, etc.

19
Adicionando Camadas em BH
Camada de Bairros

20
Adicionando áreas verdes
Bairros + Áreas Verdes + Pampulha

21
Adicionando rios Bairros + Áreas Verdes + Pampulha + Rios

22
Adicionando homicídios
Bairros + Áreas Verdes + Pampulha + Rios+ Homicídios

23
Escala - Homicídios em Belo Horizonte (98)
")
24
Escala - Região Central

25
Escala: definição Mapas são representações da realidade em miniatura. Escala indica como é esta miniatura Escala é expressa como uma razão entre uma unidade (cm) no mapa e a mesma unidade no mundo real Assim, uma escala de 1:10000 significa que 1 cm no mapa representa cm (ou 100 m) no mundo A escala não depende de uma unidade, é a mesma em cm, m, km, etc.
 no mapa e a mesma unidade no mundo real. Assim, uma escala de 1:10000 significa que 1 cm no mapa representa cm (ou 100 m) no mundo. A escala não depende de uma unidade, é a mesma em cm, m, km, etc.")
26
Escala: terminologia Ás vezes, é confuso
Pequena escala: razão é pequena Por exemplo, mapa-mundi da National Geographic tem 1 : Larga (ou grande) escala: razão é grande Por exemplo, planta arquitetônica de casa pode ter 1 : 400 Regra de bolo: mapas de pequena escala mostram grandes regiões; mapas de larga escala mostram pequenas regiões.
 escala: razão é grande. Por exemplo, planta arquitetônica de casa pode ter 1 : 400. Regra de bolo: mapas de pequena escala mostram grandes regiões; mapas de larga escala mostram pequenas regiões.")