Carregar apresentação
1
Aparelho urinário 2006/2007 João Alpendre
Serviço Universitário de Radiologia do Hospital Pulido Valente

2
TÉCNICAS RADIOLÓGICAS
TOMOGRAFIA COMPUTORIZADA RESSONÂNCIA MAGNÉTICA ECOTOMOGRAFIA RADIOGRAFIA SIMPLES DO ABDÓMEN OUTRAS TÉCNICAS (urografia de eliminação….) ORDEM?
 ORDEM")
3
TOMOGRAFIA COMPUTORIZADA

4
Lembrar a anatomia Linhas de referência Densidades básicas Ar
TOMOGRAFIA COMPUTORIZADA Lembrar a anatomia Linhas de referência Densidades básicas Ar Gordura Água Músculo Cálcio

5
Rins Topografia: Retroperitoneais Na metade superior do abdómen
Envoltos pela gordura perirrenal e fascia perirrenal

6
Relações com outros órgãos:
Face posterior: Segmento diafragmático: Diafragma, 2 últimos arcos costais Segmento lombar: psoas, quadrado lombar, aponevrose do transverso; grande dorsal e massa comum paravertebral

7
Face anterior: RD: Fígado (fundo saco peritoneal hepato-renal); Ângulo hepático; duodeno
; Ângulo hepático; duodeno")
8
RE: Baço e cauda do pâncreas, ângulo esplénico, ansas delgado

9
Contorno interno: Hilo: pedículo vascular (vasos, nervos, bacinete, uretero)
")
10
Glândulas Supra-renais
POLOS Glândulas Supra-renais Adjacentes ao polo superior de cada rim rodeadas pela gordura peri-renal

22
Orientação: Oblíquos para baixo, fora e diante, empurrados pelo psoas que aumenta o seu diâmetro inferiormente. O psoas condiciona também a rotação de 30º ao longo do eixo crânio-caudal

24
Morfologia: Forma de feijão. Grande eixo crânio-caudal Duas faces convexas, anterior e posterior Dois contornos, externo(convexo) e interno (côncavo),cujo centro é o hilo do órgão Dois pólos, superior e inferior 10-12 cm diâmetro bipolar
 e interno (côncavo),cujo centro é o hilo do órgão. Dois pólos, superior e inferior cm diâmetro bipolar.")
25
Estrutura Cápsula Parênquima renal: Cortex Medula Seio renal

30
UROGRAFIA DE ELIMINAÇÃO
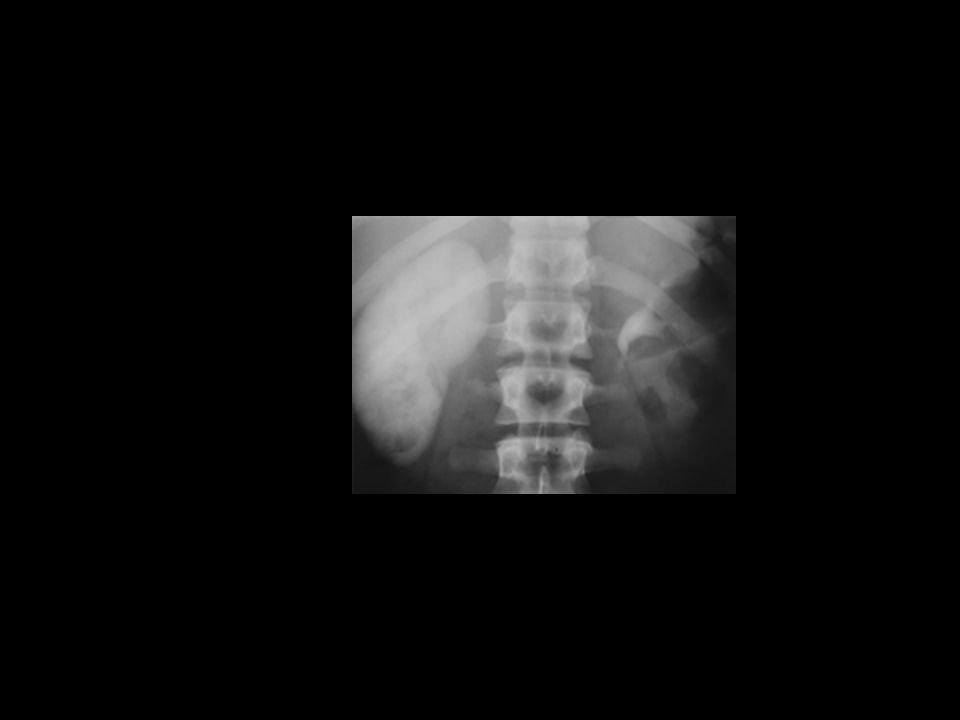
1 EXAME ULTRAPASSADO 2 O PRIMEIRO RADIOGRAM É SEM CONTRASTE The preliminary kidney, ureter, bladder (KUB) radiograph is an indispensable part of the sequence. This image should be obtained with appropriate technique (65–75 kVp, high milliam-perage, short exposure time) to maximize inherent soft-tissue contrast and optimize visualization of calcium-containing lesions that are potentially of urinary tract origin (8). "Proper" KUB radiography may require additional images for evaluating portions of the urinary tract not seen on the standard 14 x 17-inch image. Imaging should encompass the area from the suprarenal region to a level below the symphysis pubis (Fig 1) (8).
 radiograph is an indispensable part of the sequence. This image should be obtained with appropriate technique (65–75 kVp, high milliam-perage, short exposure time) to maximize inherent soft-tissue contrast and optimize visualization of calcium-containing lesions that are potentially of urinary tract origin (8). Proper KUB radiography may require additional images for evaluating portions of the urinary tract not seen on the standard 14 x 17-inch image. Imaging should encompass the area from the suprarenal region to a level below the symphysis pubis (Fig 1) (8).")
31
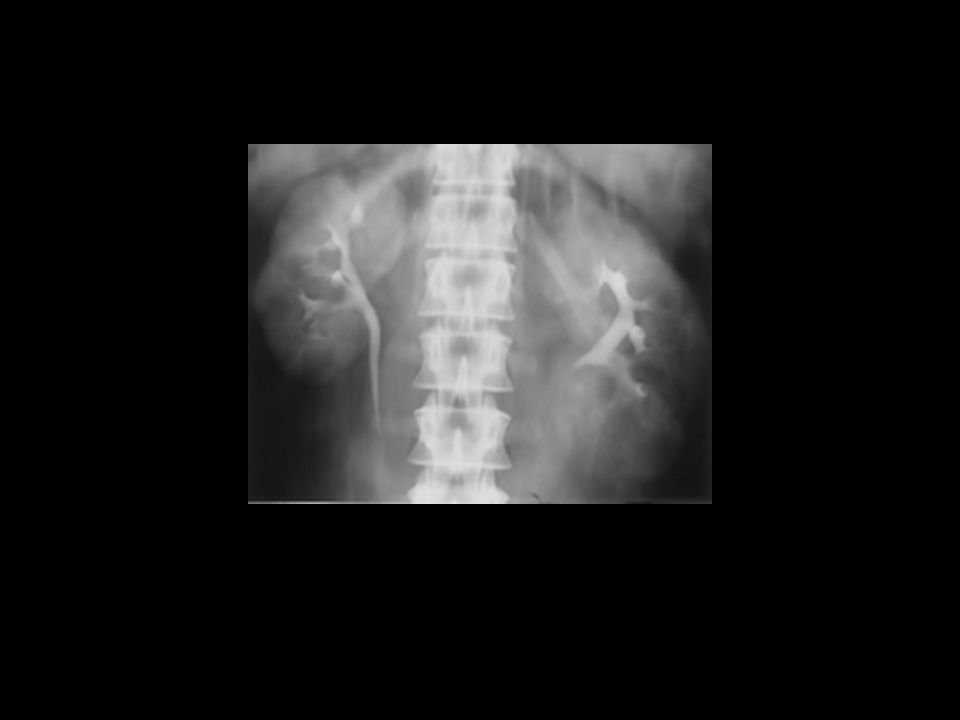
1 APOS RADIOGRAMA SIMPLES COM OU SEM INCIDENCIA COMPLEMENTARES E COM A POSSIBILIDADE DE TOMOGRAFIAS
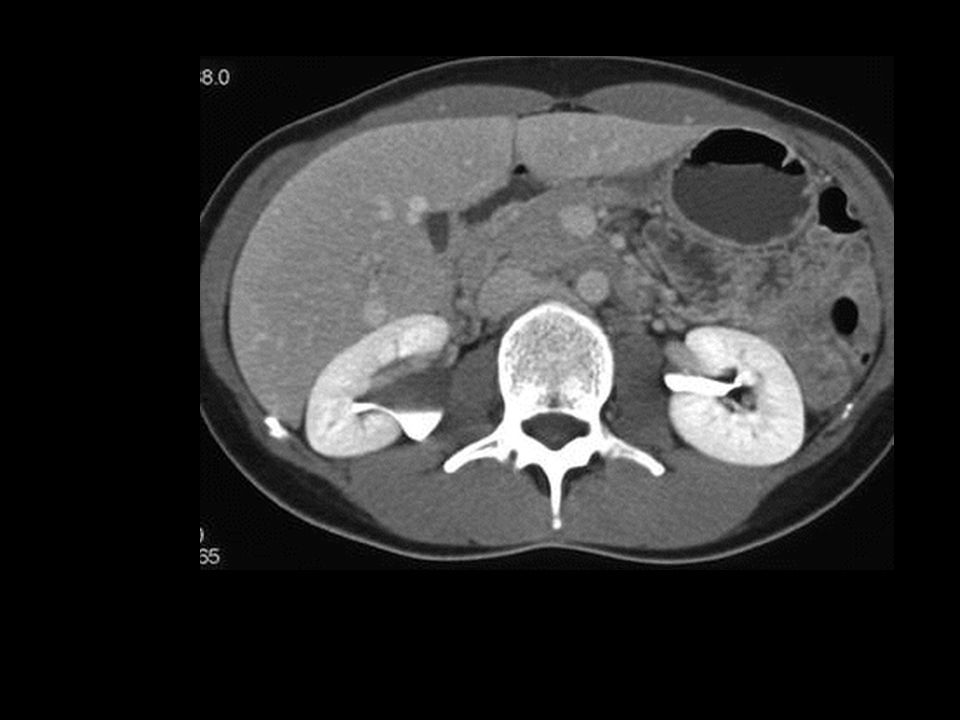
2 INJECCAO DE CONTRASTE COM FASE NEFROGRAFICA. 3 VEMOS MELHOR OS RINS, A SUA POSICAO (polo superior de ambos os rins acima da 12 costela, direito mais baixo por causa do figado) ,ORIENTACAO (paralelo ao eixo do psoas), DIMENSOES(9-13),Simetria (assimetria das dimensoes mais de 2 cm), OS SEUS CONTORNOS 4 ASSIMETRIAS DE CAPTACAO CONTRASTE
 ,ORIENTACAO (paralelo ao eixo do psoas), DIMENSOES(9-13),Simetria (assimetria das dimensoes mais de 2 cm), OS SEUS CONTORNOS. 4 ASSIMETRIAS DE CAPTACAO CONTRASTE.")
32
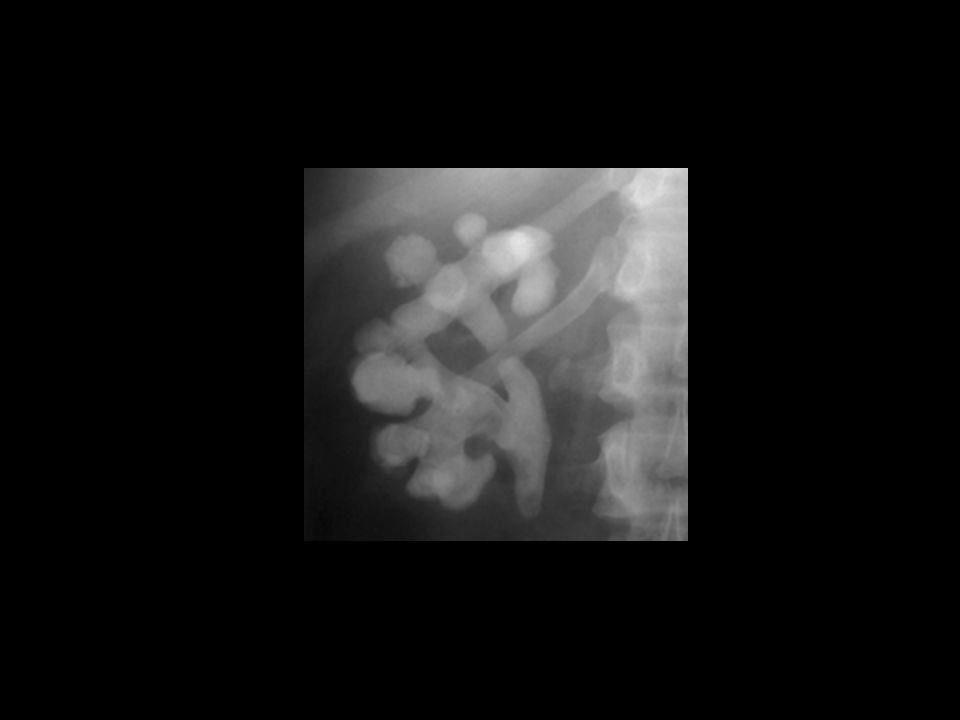
In patients who are to undergo nephrotomography after contrast material administration, a preliminary nephrotomogram is obtained. We use the following formula to determine our preliminary tomographic level (11–13): (anteroposterior abdominal diameter [cm] x ) - 2 cm. In virtually all new patients, we perform nephrotomography following the bolus administration of contrast material for optimal renal parenchymal visualization. Urographic nephrograms are produced primarily by filtered contrast material within the nephron, with optimal visualization of the renal parenchyma 1–3 minutes after bolus injection (19). The tomographic levels are determined on the basis of the scout tomographic findings as described earlier. Linear tomography performed with a 20° arc allows coverage of most kidneys in three images separated by 1 or 2 cm. It is imperative that the entire renal outline be visualized for optimal mass detection. Masses that project from the anterior or posterior aspect of the kidney but do not produce distortion of the renal outline at lin-ear tomography may be overlooked. In such cases, oblique radiographs or oblique nephrotomograms may be of added benefit if findings allow lateralization. The renal parenchyma is optimally assessed during the nephrographic phase of urography. The entire renal contour should be assessed, and nephrotomography almost always affords better visualization than standard imaging. The renal contour should be smooth, and the inability to visualize a given portion of the contour requires explanation. There should be temporal symmetry of the nephrographic development (5). Nephrographic evolution requires adequate renal blood flow, normal parenchymal excretory function without obstruction, and normal venous outflow (Figs 9, 10) (5,19). The size of the kidneys should be assessed on every urogram, and this is best performed during the nephrographic phase. There is inherent magnification in conventional radiography compared with other imaging modalities. The normal kidney may range from 9 to 13 cm in cephalocaudal length, with the left kidney inherently larger than the right by 0.5 cm and the kidneys slightly larger in men than in women (7,28–30). Several methods of assessing renal size have been reported, but approximate symmetry should be anticipated. Significant discrepancies (right kidney cm larger than the left kidney, left kidney 2 cm larger than the right kidney) require explanation
![In patients who are to undergo nephrotomography after contrast material administration, a preliminary nephrotomogram is obtained. We use the following formula to determine our preliminary tomographic level (11–13): (anteroposterior abdominal diameter [cm] x ) - 2 cm.](http://slideplayer.com.br/slide/325670/1/images/32/In+patients+who+are+to+undergo+nephrotomography+after+contrast+material+administration%2C+a+preliminary+nephrotomogram+is+obtained.+We+use+the+following+formula+to+determine+our+preliminary+tomographic+level+%2811%E2%80%9313%29%3A+%28anteroposterior+abdominal+diameter+%5Bcm%5D+x+%29+-+2+cm..jpg "In virtually all new patients, we perform nephrotomography following the bolus administration of contrast material for optimal renal parenchymal visualization. Urographic nephrograms are produced primarily by filtered contrast material within the nephron, with optimal visualization of the renal parenchyma 1–3 minutes after bolus injection (19). The tomographic levels are determined on the basis of the scout tomographic findings as described earlier. Linear tomography performed with a 20° arc allows coverage of most kidneys in three images separated by 1 or 2 cm. It is imperative that the entire renal outline be visualized for optimal mass detection. Masses that project from the anterior or posterior aspect of the kidney but do not produce distortion of the renal outline at lin-ear tomography may be overlooked. In such cases, oblique radiographs or oblique nephrotomograms may be of added benefit if findings allow lateralization. The renal parenchyma is optimally assessed during the nephrographic phase of urography. The entire renal contour should be assessed, and nephrotomography almost always affords better visualization than standard imaging. The renal contour should be smooth, and the inability to visualize a given portion of the contour requires explanation. There should be temporal symmetry of the nephrographic development (5). Nephrographic evolution requires adequate renal blood flow, normal parenchymal excretory function without obstruction, and normal venous outflow (Figs 9, 10) (5,19). The size of the kidneys should be assessed on every urogram, and this is best performed during the nephrographic phase. There is inherent magnification in conventional radiography compared with other imaging modalities. The normal kidney may range from 9 to 13 cm in cephalocaudal length, with the left kidney inherently larger than the right by 0.5 cm and the kidneys slightly larger in men than in women (7,28–30). Several methods of assessing renal size have been reported, but approximate symmetry should be anticipated. Significant discrepancies (right kidney 1.5 cm larger than the left kidney, left kidney 2 cm larger than the right kidney) require explanation.")
33
ÁRVORE EXCRETORA

38
Vasos

40
TOMOGRAFIA COMPUTORIZADA
Vantagens Resolução espacial Resolução de contraste Desvantagens Função Histologia Radiação, contraste Não é em tempo real Bexiga

41
TOMOGRAFIA COMPUTORIZADA
Indicações Caracterização de massas renais Estadiamento de massas renais Litíase do aparelho urinário Traumatismos Patologia vascular (estenose artéria renal, trombose venosa) Intervenção Contra-indicações Contraste Radiação
 Intervenção. Contra-indicações. Contraste. Radiação.")
42
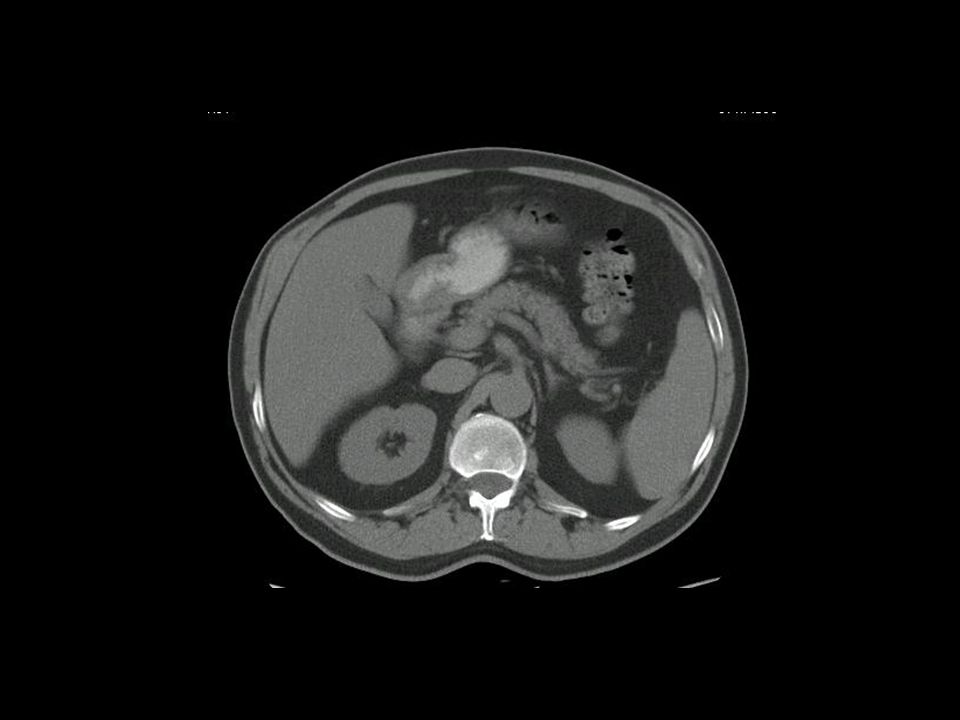
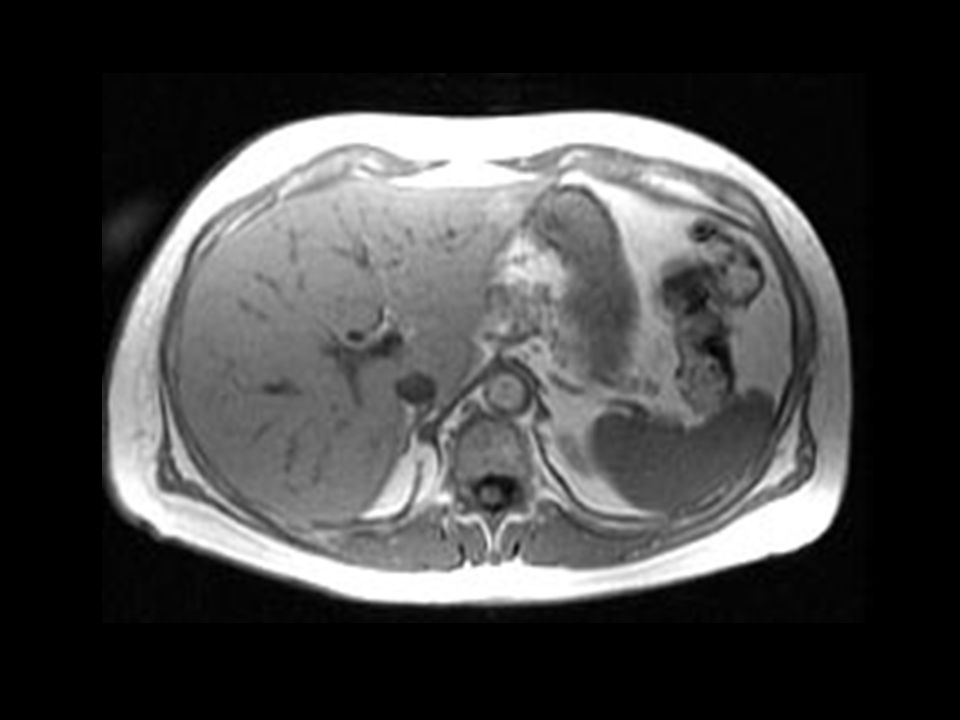
Sinais nas diferentes ponderações Ar, cálcio (sempre hiposinal)
RESSONÂNCIA MAGNÉTICA Lembrar a anatomia Nível do corte Plano anatómico Sinais nas diferentes ponderações Ar, cálcio (sempre hiposinal) Água (hipo sinal T1, hipersinal T2) Gordura (forma grosseira hiper sinal, à excepção na saturação) Músculo (isosinal)
 Água (hipo sinal T1, hipersinal T2) Gordura (forma grosseira hiper sinal, à excepção na saturação) Músculo (isosinal)")
43
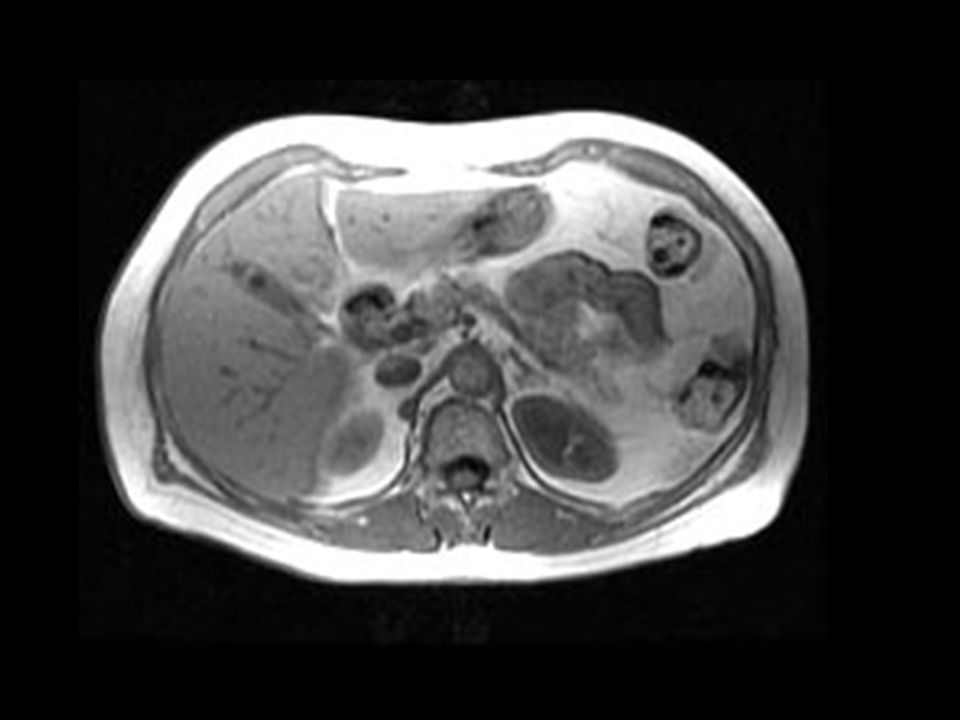
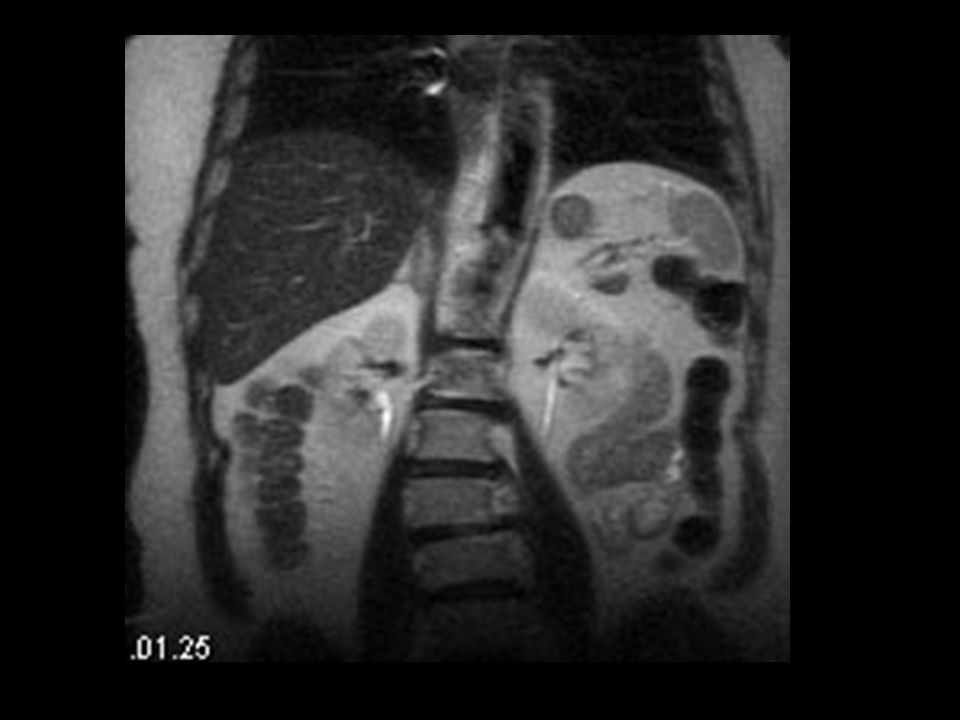
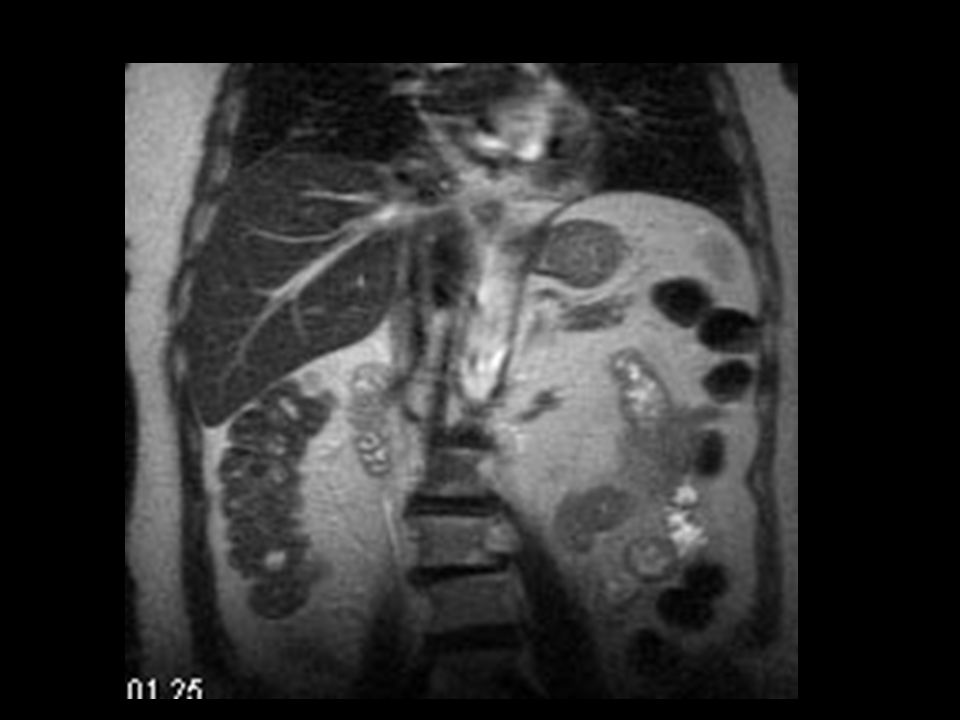
T1 RM normal T1 sem e com saturação gordura onde observamos a diferenciação ps T2 coronal com quisto

44
T1 com supressão gordura

45
T2

46
T1 com gadolínio e saturação de gordura, fase nefrográfica cortico-medular
T1 com gadolinio fase nefrografica precoce e terdia Angio rm

47
T1 com gadolínio e saturação de gordura, fase nefrográfica
T1 com gadolinio fase nefrografica precoce e terdia Angio rm

50
RESSONÂNCIA MAGNÉTICA
Vantagens Sem radiação ionizante Não usar contraste iodado Maior resolução tecidular Desvantagens Campo magnético Dispendiosa/menos acessível/demorada/”hábito” Litíase

51
RESSONÂNCIA MAGNÉTICA
Indicações: Habitualmente utilizada em doentes com contra-indicações à utilização de contraste iodado Estudo pélvico Contra-indicações: Pace-maker…

52
ECOTOMOGRAFIA Cortes sagitais e axiais Parênquima (cortical e medular) Seio renal Ecogenicidades Anecogénico (urina); hipoecogénico; isoecogénico (parênquima); hiperecogénico (seio renal)
; hipoecogénico; isoecogénico (parênquima); hiperecogénico (seio renal)")
53
ECOTOMOGRAFIA Vantagens: Acessibilidade Portátil
Caracterização sólido/líquido Tempo real Sem contraste ev Sem radiação Bexiga Desvantagens Dependente do examinado (janela, colaboração) Dependente do operador Reprodutibilidade Função Uretero
 Dependente do operador. Reprodutibilidade. Função. Uretero.")
54
ECOTOMOGRAFIA Indicações Dimensões, topografia
Dilatação da árvore excretora Caracterização sólido/líquido Estudo pélvico Intervenção Contra-indicações Não tem

55
RADIOGRAFIA SIMPLES DO ABDÓMEN
Na metade superior do abdómen Envoltos pela gordura perirrenal Permitindo a sua visualização no RX Polo superior do RE-espaço intervertebral D11-D12 (expiração e decúbito dorsal) Polo inferior do RD-contorno superior de L3 RE 1cm acima do RD (fígado)
 Polo inferior do RD-contorno superior de L3. RE 1cm acima do RD (fígado)")
56
RADIOGRAFIA SIMPLES DO ABDÓMEN
LIMITAÇÕES ÓBVIAS INDICAÇÃO: 1 LITÍASE

57
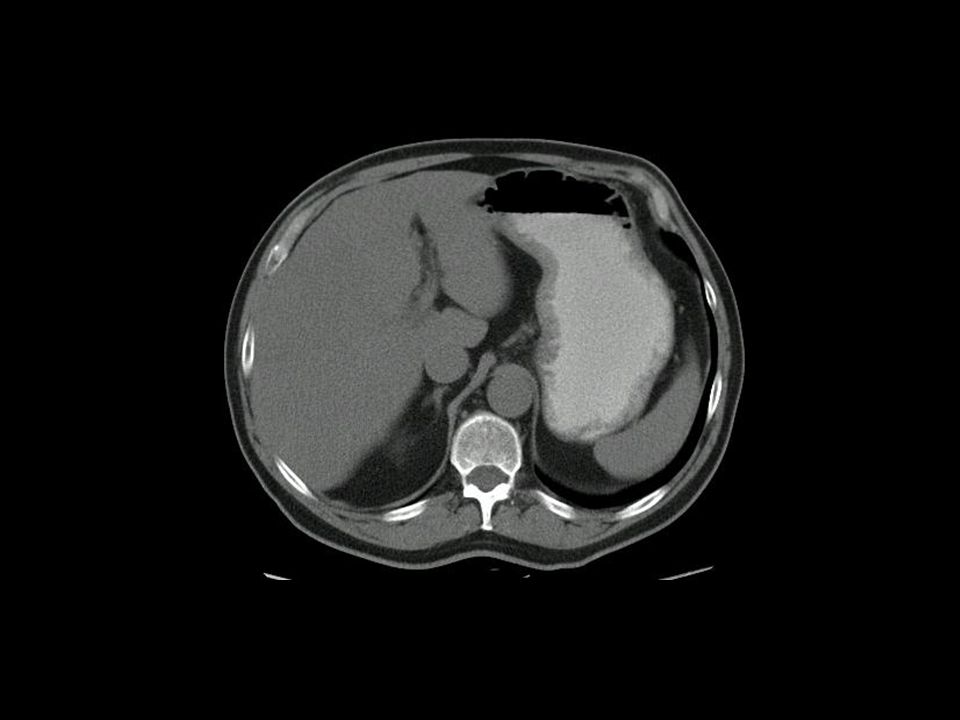
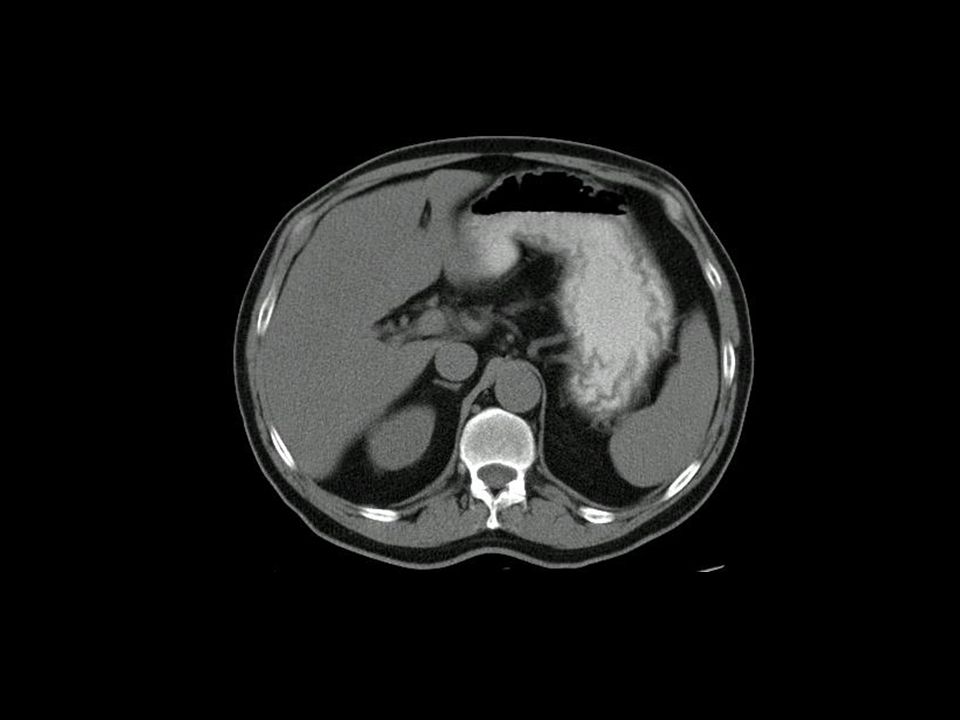
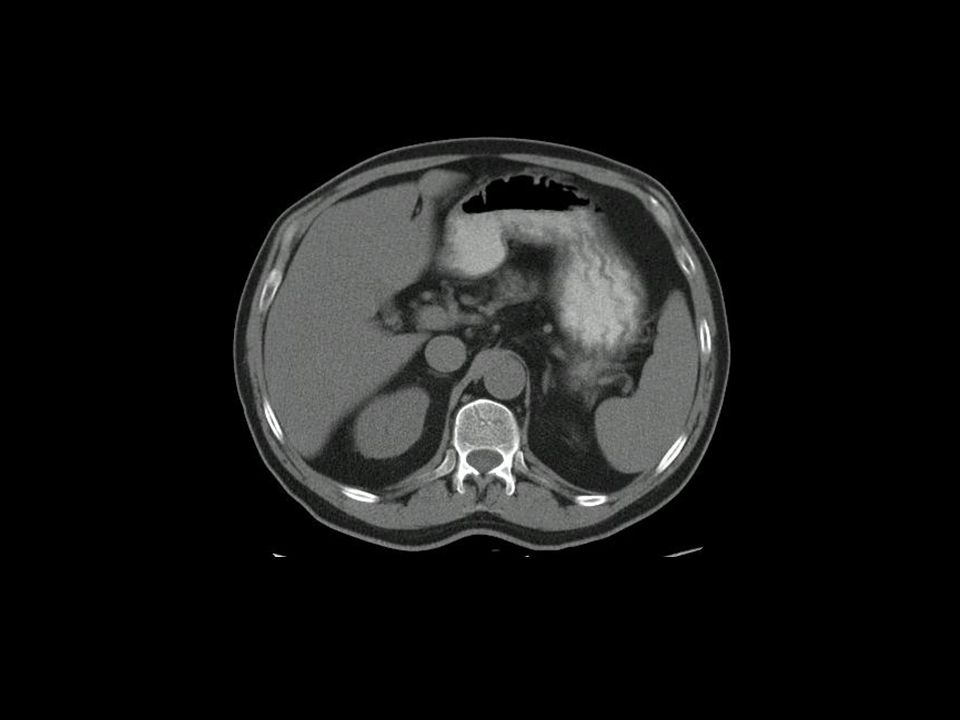
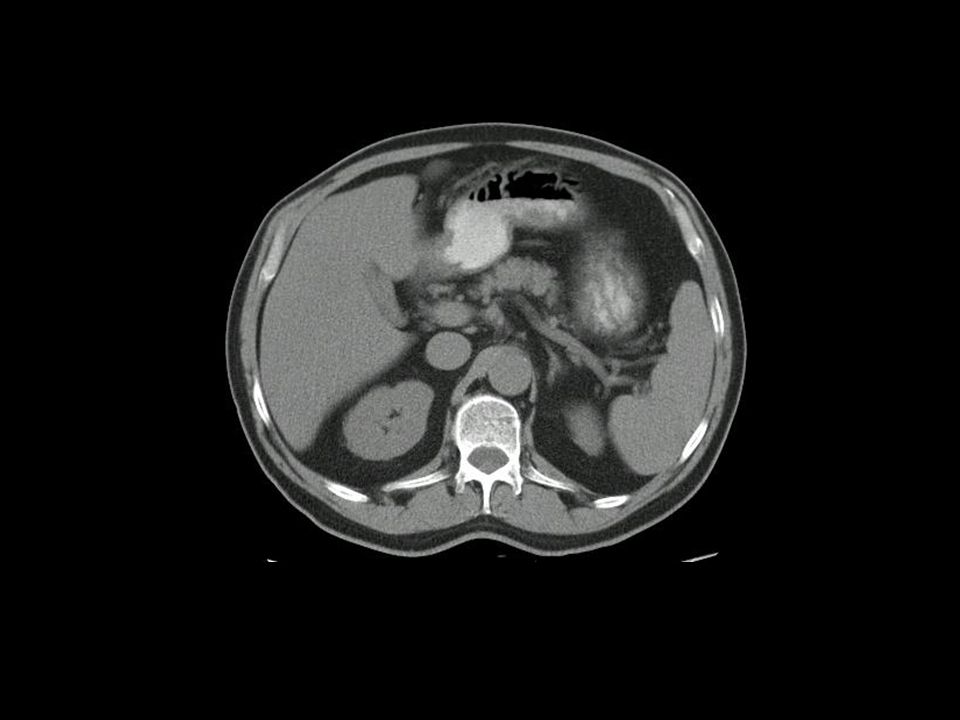
LESÕES RENAIS OCUPANDO ESPAÇO

58
LESÕES RENAIS OCUPANDO ESPAÇO

60
Quistos parapielicos

63
LESÕES RENAIS OCUPANDO ESPAÇO

64
Quisto complexo,t1, t1 com fat sat, t2, t1 com contraste

65
LESÕES RENAIS OCUPANDO ESPAÇO
QUISTO COMPLEXO

66
LESÕES RENAIS OCUPANDO ESPAÇO

67
LESÕES RENAIS OCUPANDO ESPAÇO

69
LESÕES RENAIS OCUPANDO ESPAÇO

70
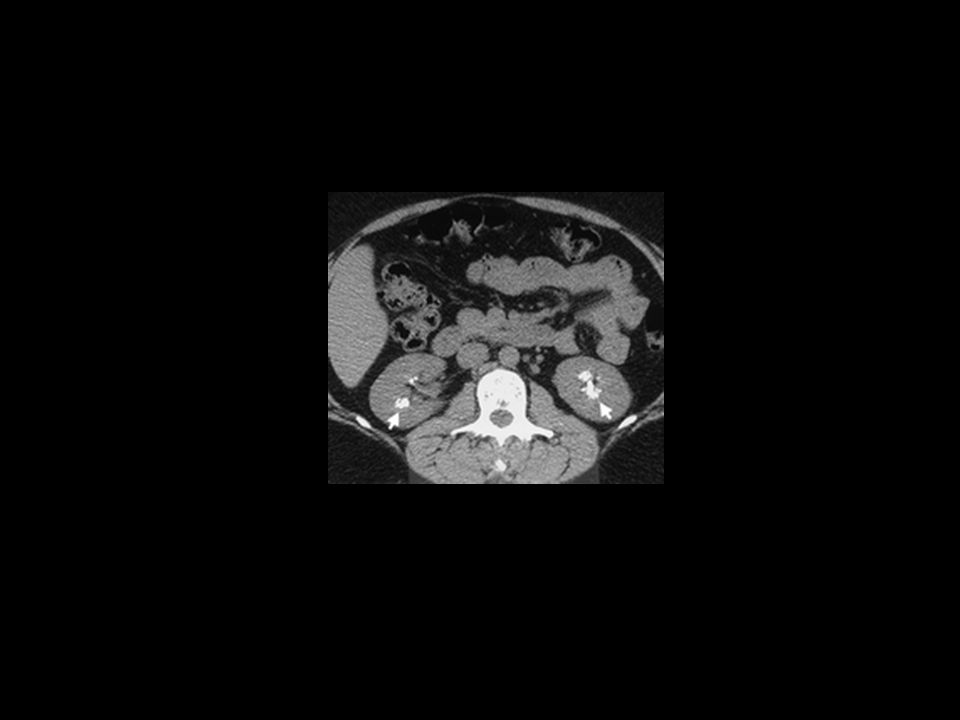
CÓLICA RENAL DIREITA RADIOGRAMA SIMPLES DO ABDOMEN
1 PARA QUÊ(CALCIFICAÇÕES) 2 DEITADO OU EM PÉ? 3 COMO TEMOS A CERTEZA QUE A IMAGEM DE DENSIDADE CÁLCICA É LITIASE RENAL OU URETERAL? CORALIFORME PERFIS INSPIRACAO/EXPIRACAO TOMOGRAFIAS
 2 DEITADO OU EM PÉ 3 COMO TEMOS A CERTEZA QUE A IMAGEM DE DENSIDADE CÁLCICA É LITIASE RENAL OU URETERAL CORALIFORME. PERFIS. INSPIRACAO/EXPIRACAO. TOMOGRAFIAS.")
72
Dificuldades na interpretacao:
Anatomia complexa do sacro Calculos radiotransparentes Gas Flebolitos e outros

73
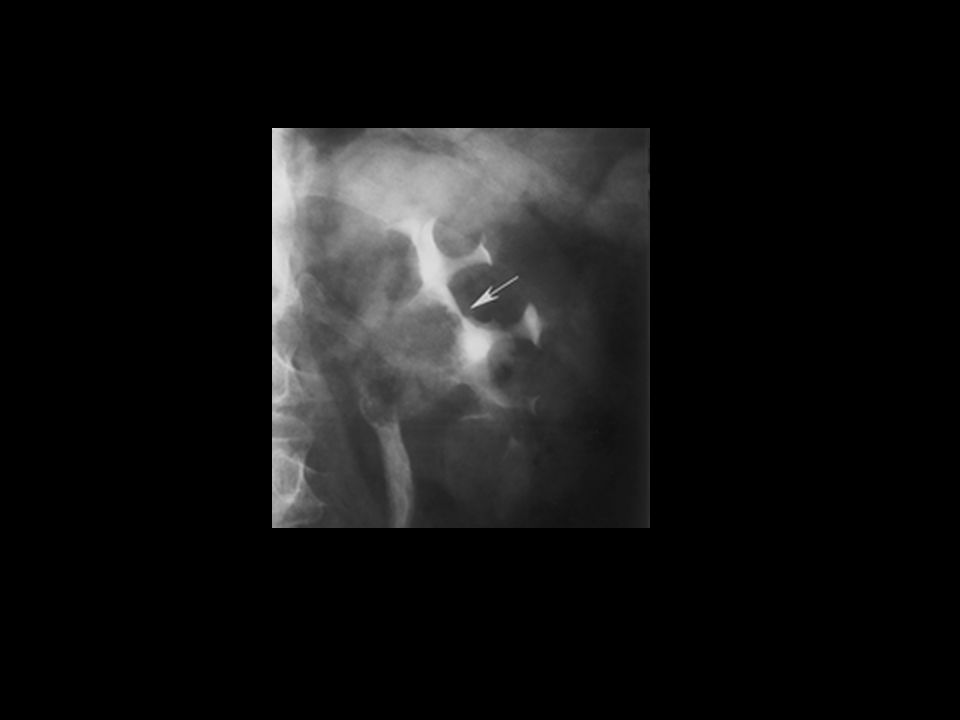
CÓLICA RENAL DIREITA

75
Ureterolito na uniao uretero vesical com boe edema

76
ureterocelo

77
Megauretero primario

78
CÓLICA RENAL DIREITA

80
HOMEM IDOSO, INTERNADO POR IRA

81
HOMEM IDOSO, INTERNADO POR IRA

82
Bexiga na hbp

83
Bexiga normal

84
Doente com hematúria total
Carcinoma urotelio

85
Carcinoma de cels transicao bexiga

88
OBSTRUCAO CRÓNICA

89
TRAUMA traumatismos

90
DOENTE COM HIPERTENSÃO ARTERIAL CONTROLADA COM 4 ANTI-HIPERTENSIVOS
ATROFIA POS ObSTRUCAO

91
LESÕES VASCULARES

94
DOENTE COM AUMENTO DA UREIA E CREATININA

95
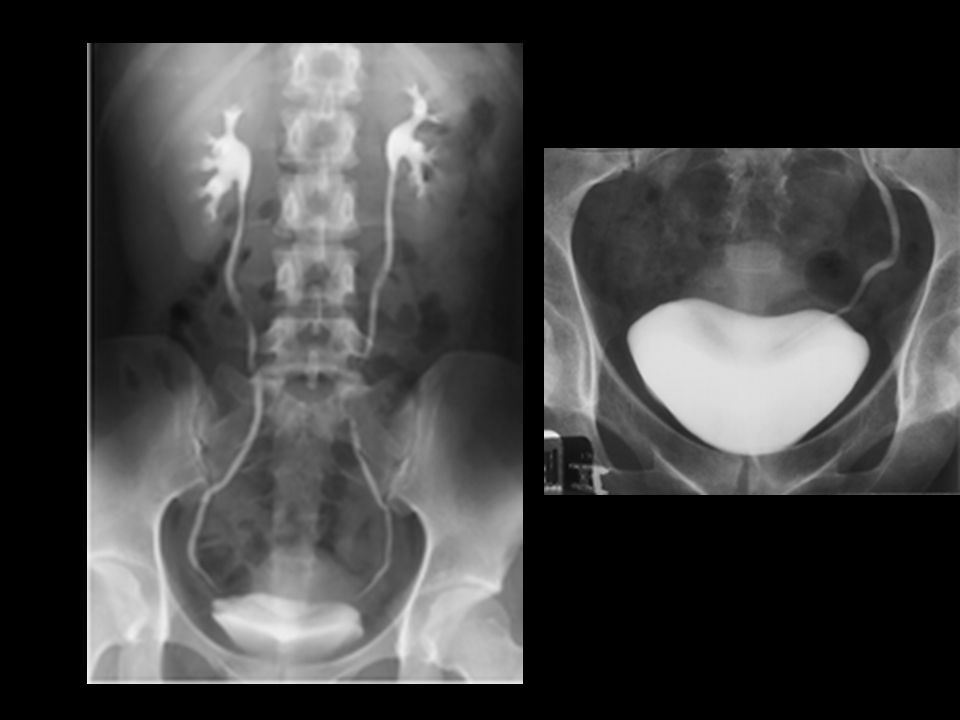
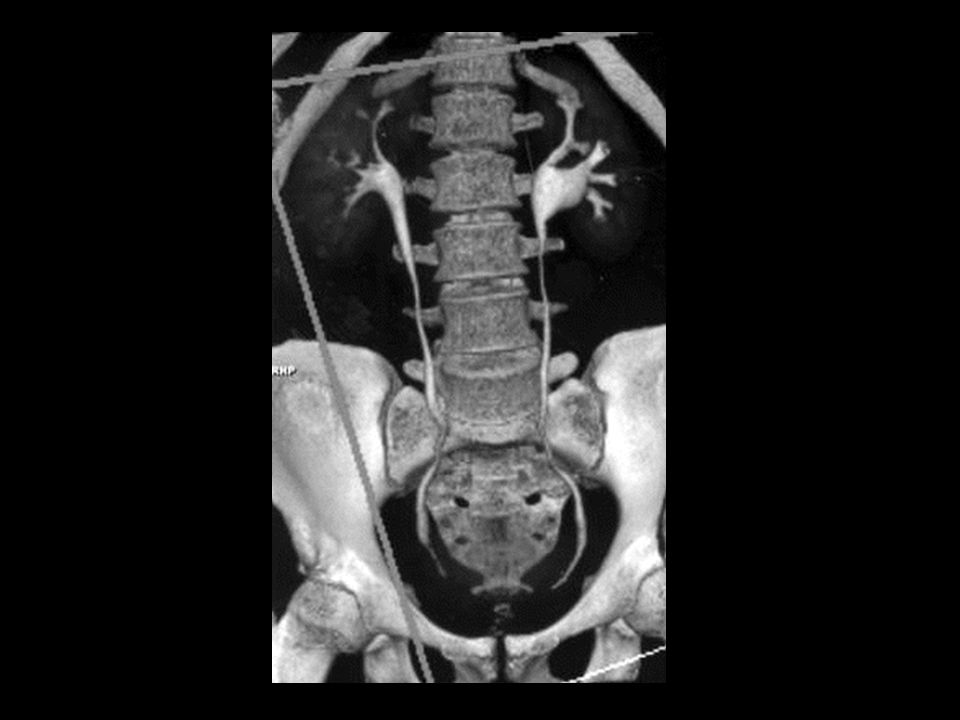
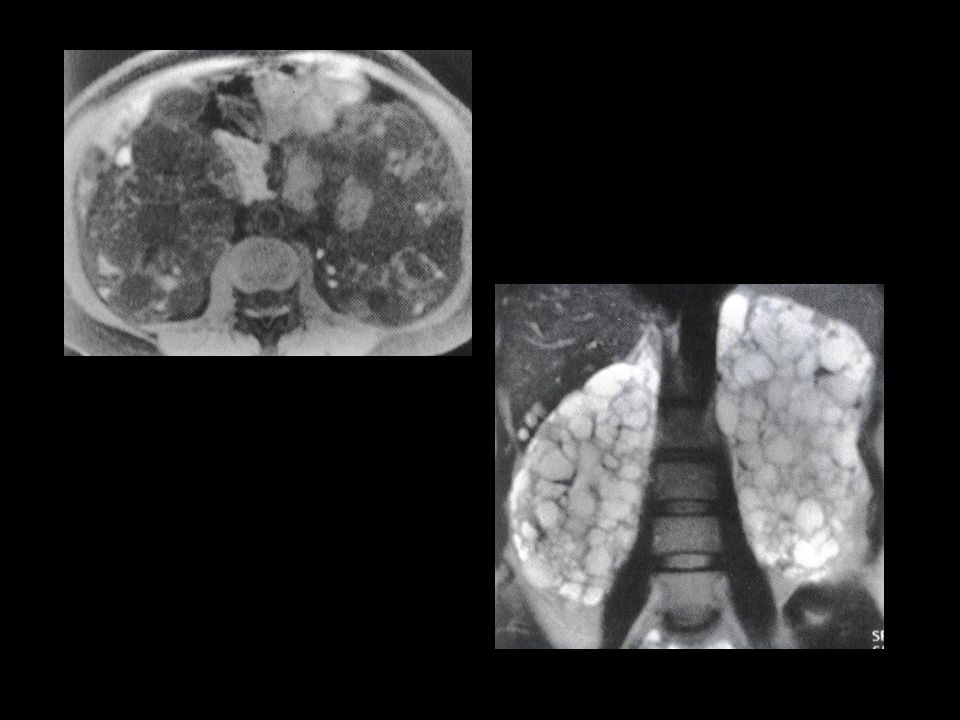
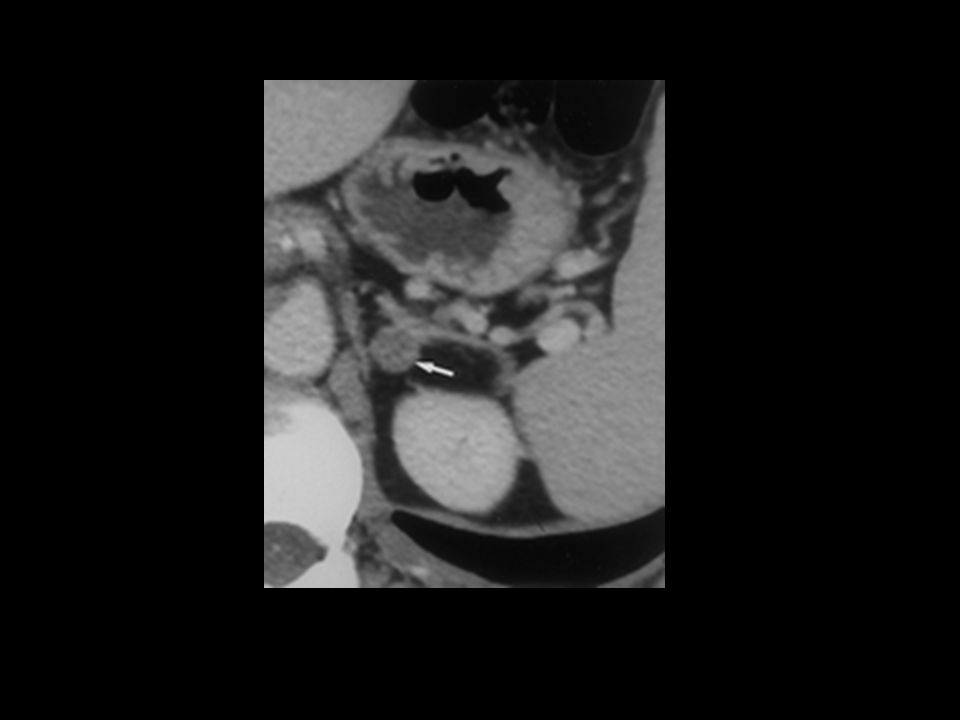
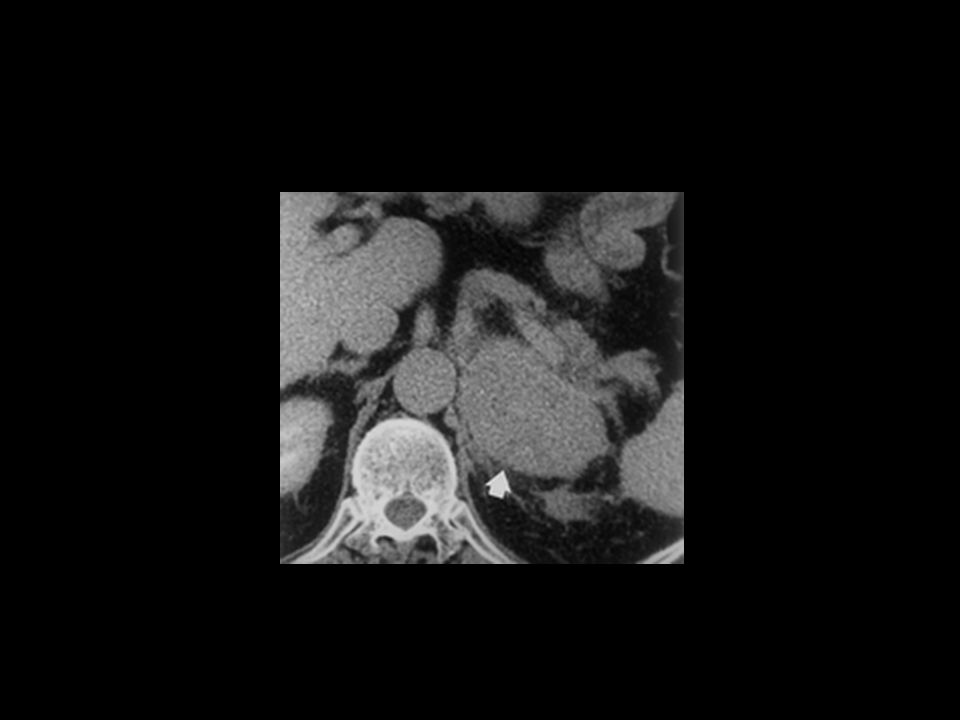
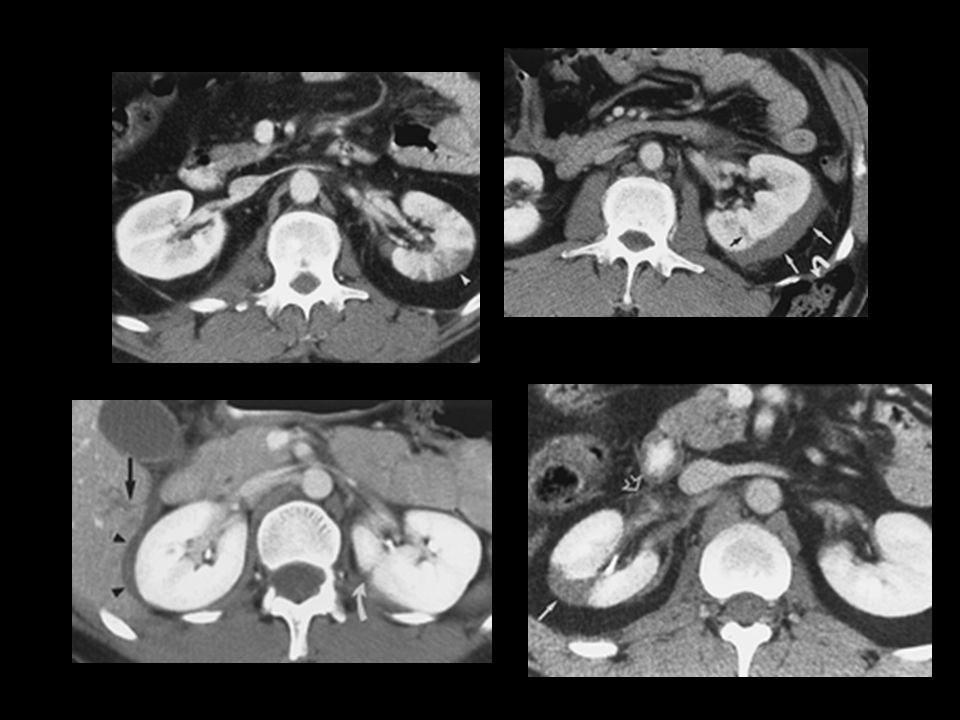
The position of the kidney should also be assessed at nephrotomography
The position of the kidney should also be assessed at nephrotomography. A portion of each upper renal pole usually extends above the 12th rib, with the right kidney normally slightly lower than the left due to the position of the liver. The vertical axis of the kidney should parallel the upper one-third of the psoas muscle. Alterations in axis and position may occur as a response to abdominal or retroperitoneal masses, alterations in visceral size, or congenital renal anomalies related to position or fusion (Fig 21).
.")
97
Doente com febre, vómitos, dor lombar
Pielonefrite

98
Doente diabético, com febre, disúria
Cistite enfisematosa

100
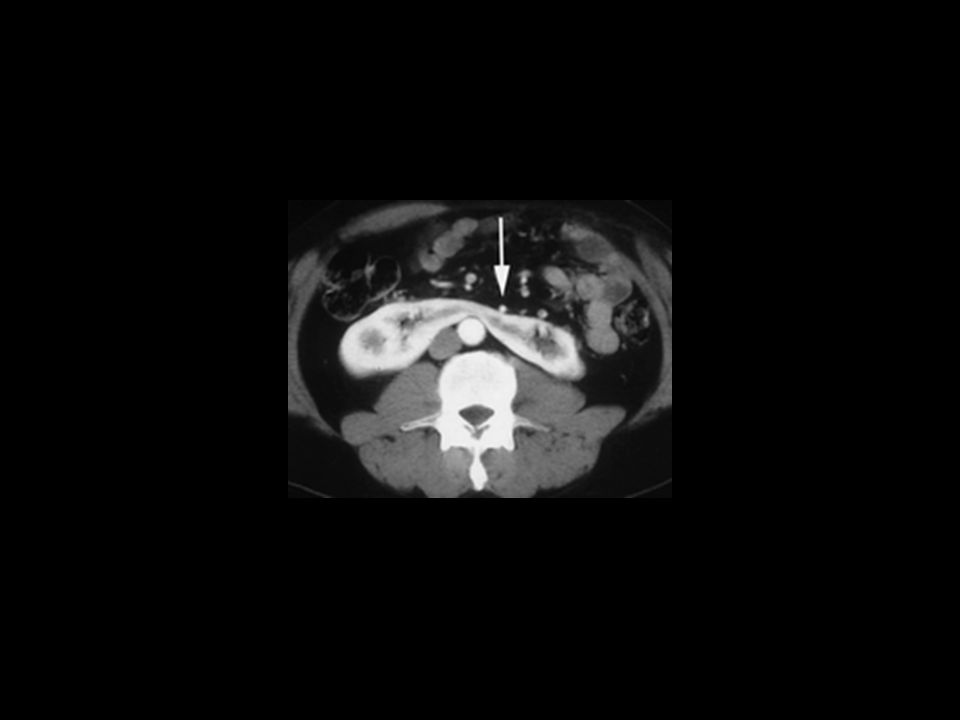
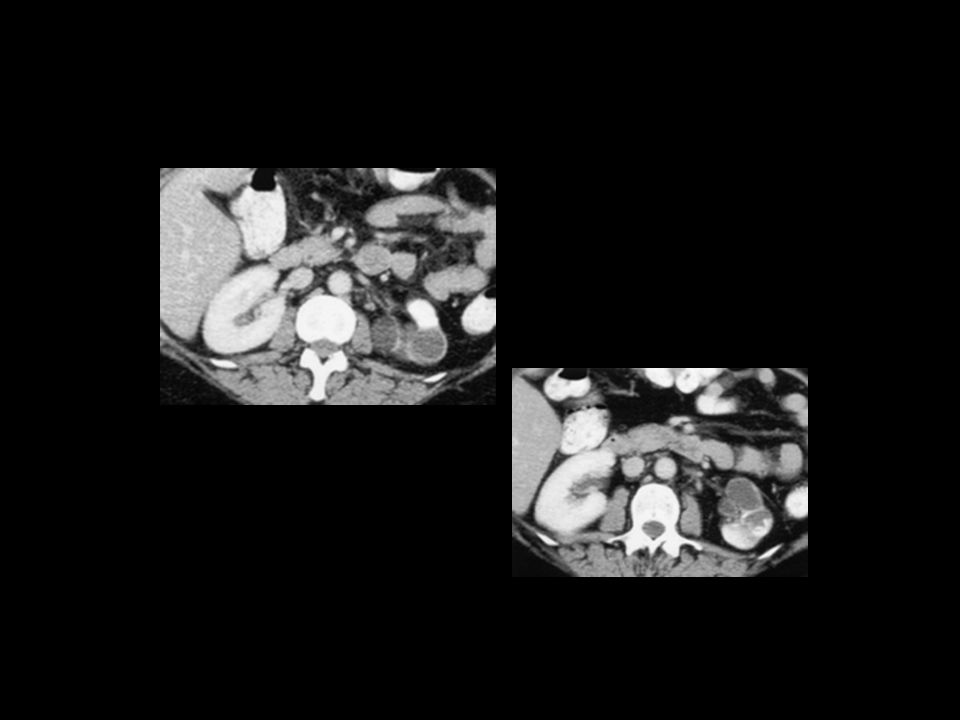
Massas empurrando os ureteros

101
CONTORNOS E CALICES NA NEFROPatia de rEFLUXO

102
Necrose papilar da nefropatia dos analgesicos

109
GENITAL FEMININO Ecografia: Suprapúbica Endocavitária RM TC- Não

110
Normal premenopausal endometrium
Normal premenopausal endometrium. Sagittal US image of the uterus obtained during menstruation shows a thin endometrial lining (arrow) with a trace of fluid. Normal premenopausal endometrium. Sagittal US image of the uterus obtained during the late proliferative phase of the menstrual cycle demonstrates the endometrium with a multilayered appearance (arrows). Normal premenopausal endometrium. Sagittal US image of the uterus obtained during the secretory phase of the menstrual cycle shows a thickened, echogenic endometrium (cursors). Normal premenopausal endometrium. T2-weighted MR image shows the normal endometrium (straight arrow) and junctional zone (curved arrow
 with a trace of fluid. Normal premenopausal endometrium. Sagittal US image of the uterus obtained during the late proliferative phase of the menstrual cycle demonstrates the endometrium with a multilayered appearance (arrows). Normal premenopausal endometrium. Sagittal US image of the uterus obtained during the secretory phase of the menstrual cycle shows a thickened, echogenic endometrium (cursors). Normal premenopausal endometrium. T2-weighted MR image shows the normal endometrium (straight arrow) and junctional zone (curved arrow.")
111
Normal uterus in a woman of reproductive age
Normal uterus in a woman of reproductive age. Sagittal T2-weighted image of the uterus shows the endometrium (E), junctional zone (short arrows), and myometrium (M). It also shows the epithelium (arrowhead), fibrous stroma (long arrow), and peripheral myometrium (m) of the cervix Postmenopausal uterus. Sagittal T2-weighted image shows a small uterine corpus that is almost the same size as the cervix (arrows). The zonal anatomy of the corpus is indistinct.
, junctional zone (short arrows), and myometrium (M). It also shows the epithelium (arrowhead), fibrous stroma (long arrow), and peripheral myometrium (m) of the cervix. Postmenopausal uterus. Sagittal T2-weighted image shows a small uterine corpus that is almost the same size as the cervix (arrows). The zonal anatomy of the corpus is indistinct.")
112
Postmenopausal endometrial atrophy
Postmenopausal endometrial atrophy. Transvaginal US image demonstrates a postmenopausal endometrium with thin walls and outlined with fluid. Postmenopausal endometrial atrophy. T2-weighted MR image demonstrates an atrophic postmenopausal endometrium (arrows).
.")
113
Mayer-Rokitansky-Küster-Hauser syndrome in a woman with primary amenorrhea. B = bladder. (a) Sagittal T2-weighted image shows uterine agenesis and absence of the vagina. (b) Coronal image obtained with true fast imaging with steady-state precession shows agenesis of the left kidney. Note the normal right ovary with follicles (arrow). Arrowheads = right kidney.
 Sagittal T2-weighted image shows uterine agenesis and absence of the vagina. (b) Coronal image obtained with true fast imaging with steady-state precession shows agenesis of the left kidney. Note the normal right ovary with follicles (arrow). Arrowheads = right kidney..")
114
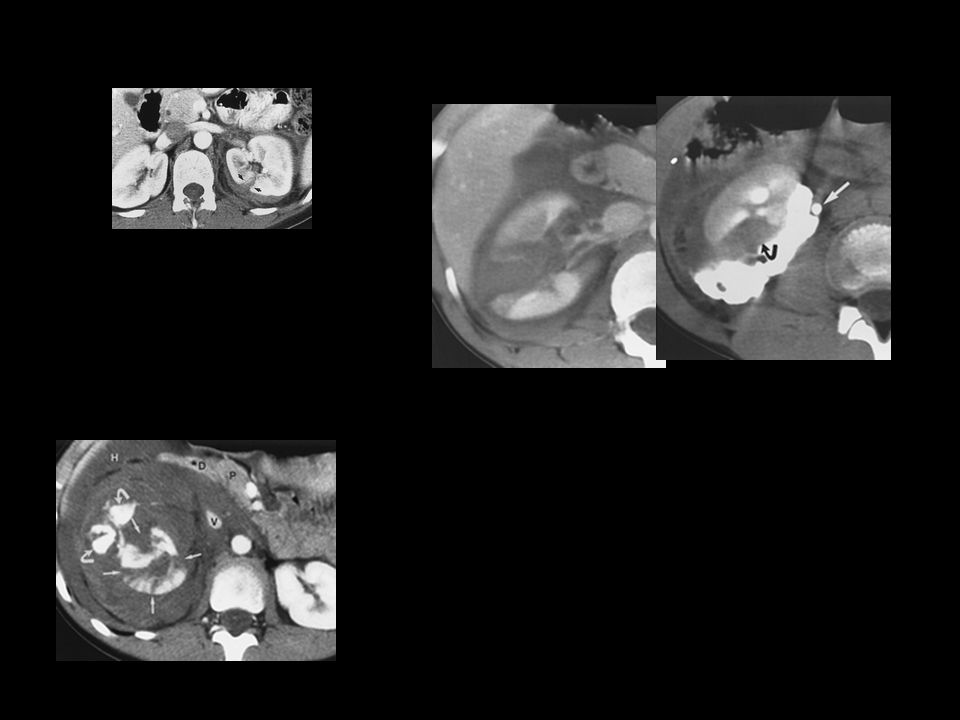
Uterus didelphys with an obstructed hemivagina
Uterus didelphys with an obstructed hemivagina. (a) Axial T2-weighted image shows two separate uteri and two cervices (arrows), all of which have normal zonal anatomy. Arrowheads = ovaries. (b) Coronal T2-weighted image shows a hematocele (H) due to obstruction of the right hemivagina. (c) Contrast-enhanced computed tomographic (CT) scan shows agenesis of the right kidney. Uterus didelphys with an obstructed hemivagina is termed Wunderlich syndrome and is usually associated with ipsilateral renal agenesis. (Reprinted, with permission, from reference 50.)
 Axial T2-weighted image shows two separate uteri and two cervices (arrows), all of which have normal zonal anatomy. Arrowheads = ovaries. (b) Coronal T2-weighted image shows a hematocele (H) due to obstruction of the right hemivagina. (c) Contrast-enhanced computed tomographic (CT) scan shows agenesis of the right kidney. Uterus didelphys with an obstructed hemivagina is termed Wunderlich syndrome and is usually associated with ipsilateral renal agenesis. (Reprinted, with permission, from reference 50.)")
115
Bicornuate uterus. Axial T2-weighted image shows two endometrial cavities and one cervix. The external uterine contour is concave (short arrow) with a large intercornual distance (arrowheads). Long arrows = nabothian cysts.
 with a large intercornual distance (arrowheads). Long arrows = nabothian cysts..")
116
Septate uterus. Axial T2-weighted image shows a normal external uterine contour (arrowheads). A thin fibrous septum is seen in the uterine cavity (arrow). (Reprinted, with permission, from reference 50.)
. (Reprinted, with permission, from reference 50.).")
118
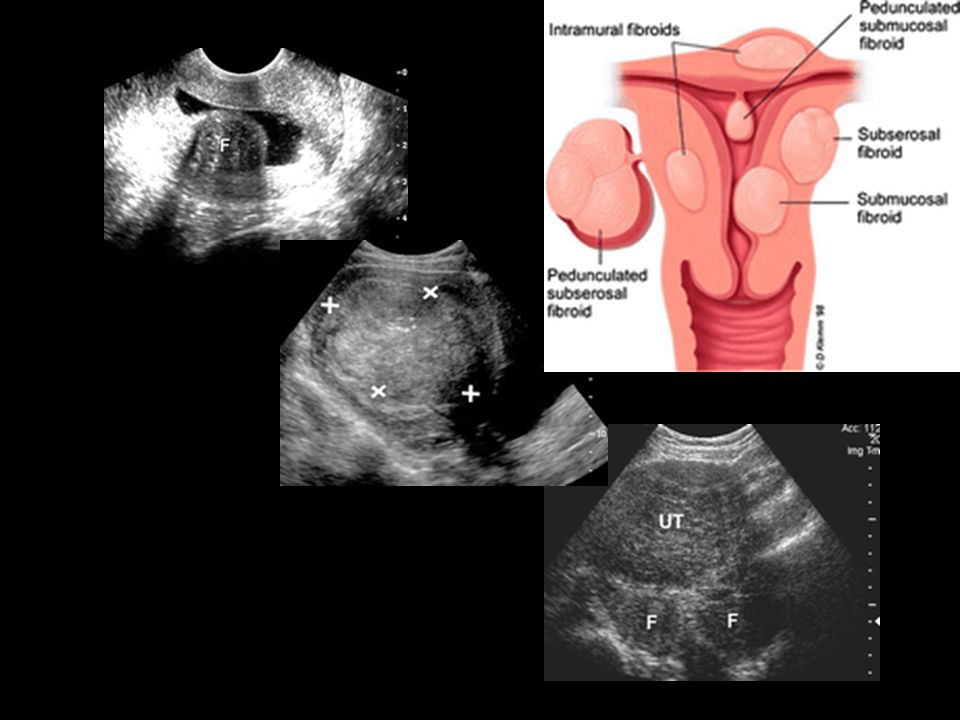
Submucosal fibroids. T2-weighted MR image shows a hypointense submucosal fibroid splaying the endometrium (arrows).
..")
119
Normal pediatric endometrium
Normal pediatric endometrium. Sagittal US image of the uterus in a 2-year-old girl demonstrates a thin endometrium (arrow). ematometrocolpos in a 12-year-old girl with abdominal pain. Sagittal US image demonstrates a markedly distended vagina (straight arrow) and uterine cavity (curved arrow).
. ematometrocolpos in a 12-year-old girl with abdominal pain. Sagittal US image demonstrates a markedly distended vagina (straight arrow) and uterine cavity (curved arrow).")
120
1Endometrial hyperplasia
1Endometrial hyperplasia. US image shows an endometrium with diffuse thickening (maximum thickness, 1.74 cm) due to hyperplasia (cursors). This finding was confirmed at biopsy. UD. US image shows a hyperechoic linear structure within the endometrial canal (arrow) representing an IUD.
 due to hyperplasia (cursors). This finding was confirmed at biopsy. UD. US image shows a hyperechoic linear structure within the endometrial canal (arrow) representing an IUD.")
121
Endometrial adenocarcinoma
Endometrial adenocarcinoma. (a) US image reveals a heterogeneous endometrial mass (arrows) that is difficult to distinguish from the myometrium. Cursors indicate the entire transverse width of the uterus. (b) T2-weighted MR image shows a large, heterogeneous tumor distending the endometrial canal (arrows). (c) CT scan also reveals a heterogeneous tumor (arrowheads).
 US image reveals a heterogeneous endometrial mass (arrows) that is difficult to distinguish from the myometrium. Cursors indicate the entire transverse width of the uterus. (b) T2-weighted MR image shows a large, heterogeneous tumor distending the endometrial canal (arrows). (c) CT scan also reveals a heterogeneous tumor (arrowheads).")
122
Endometrial polyp. Sonohysterogram reveals a small polyp attached by a stalk to the endometrium (black arrow). An echogenic focus in the endometrial cavity (white arrow) represents injected air. Endometrial polyp. T2-weighted MR image demonstrates a low-signal-intensity lesion within the endometrial canal (arrow).
.")
123
Adenomyosis. Sagittal T2-weighted image shows an enlarged uterus
Adenomyosis. Sagittal T2-weighted image shows an enlarged uterus. An ill-defined myometrial lesion of decreased signal intensity is seen in the fundus, along with multiple small hyperintense foci (arrowheads). Arrows = nabothian cysts.
. Arrows = nabothian cysts.")
124
varian cyst aspiration in a 30-year-old woman with acute lower abdominal pain. She was a poor surgical candidate, having undergone multiple prior bowel surgeries. Computed tomography (CT) was performed to evaluate for possible appendicitis or diverticulitis. (a) CT scan of the pelvis shows diffusely dilated small intestine and an 8-cm-diameter, low-attenuation right adnexal mass (arrowheads). (b) Longitudinal endovaginal color Doppler image shows a right ovarian cyst with fine, low-level internal echoes. The cyst was thought to be unilocular and avascular. Arrow = adjacent vessels. (c) Photograph shows a condom-sheathed endovaginal probe with a needle guide and a 20-cm-long, 20-gauge Chiba needle. A second condom may be added over the needle guide. (d) Longitudinal endovaginal US scan shows the needle within the cyst. Note the adjacent intestine (arrows). (e) Postaspiration longitudinal US scan shows that the cyst wall has collapsed (arrowheads). A second adjacent locule became apparent after aspiration (arrows). Continuing pain led to laparotomy and right oophorectomy. Biopsy of one cyst wall showed a serous cystadenoma; biopsy of the other cyst wall revealed a benign cyst. The fluid contained reactive mesothelial cells.
 was performed to evaluate for possible appendicitis or diverticulitis. (a) CT scan of the pelvis shows diffusely dilated small intestine and an 8-cm-diameter, low-attenuation right adnexal mass (arrowheads). (b) Longitudinal endovaginal color Doppler image shows a right ovarian cyst with fine, low-level internal echoes. The cyst was thought to be unilocular and avascular. Arrow = adjacent vessels. (c) Photograph shows a condom-sheathed endovaginal probe with a needle guide and a 20-cm-long, 20-gauge Chiba needle. A second condom may be added over the needle guide. (d) Longitudinal endovaginal US scan shows the needle within the cyst. Note the adjacent intestine (arrows). (e) Postaspiration longitudinal US scan shows that the cyst wall has collapsed (arrowheads). A second adjacent locule became apparent after aspiration (arrows). Continuing pain led to laparotomy and right oophorectomy. Biopsy of one cyst wall showed a serous cystadenoma; biopsy of the other cyst wall revealed a benign cyst. The fluid contained reactive mesothelial cells..")
125
Hemorrhagic cyst in a 41-year-old woman
Hemorrhagic cyst in a 41-year-old woman. Transverse (a) and sagittal (b) endovaginal US images show a right ovarian cyst with lacelike internal echoes, a finding that is suggestive of hemorrhagic cyst.
 and sagittal (b) endovaginal US images show a right ovarian cyst with lacelike internal echoes, a finding that is suggestive of hemorrhagic cyst.")
126
Endometrioma in a 40-year-old woman
Endometrioma in a 40-year-old woman. (a) Sagittal US image shows a cystic mass with diffuse low-level echoes. (b) T1-weighted spin-echo MR image (600/16) reveals a mass in the right ovary with high signal intensity and a discrete wall (arrow). (c) On a T2-weighted MR image (3,617/119), the mass demonstrates very low signal intensity ("shading") (arrow). These findings are typical for endometrioma.
 Sagittal US image shows a cystic mass with diffuse low-level echoes. (b) T1-weighted spin-echo MR image (600/16) reveals a mass in the right ovary with high signal intensity and a discrete wall (arrow). (c) On a T2-weighted MR image (3,617/119), the mass demonstrates very low signal intensity ( shading ) (arrow). These findings are typical for endometrioma.")
128
Ovarian endometriomas
Ovarian endometriomas. Axial T1-weighted (a) and T2-weighted (b) images show bilateral ovarian endometriomas with high signal intensity (arrows). High signal intensity on both T1- and T2-weighted images is typical of ovarian endometriomas. The interface between the right and left endometriomas is obscured (so-called kissing ovary). Low-signal-intensity stranding (arrowheads) is seen between the kissing ovary and the sigmoid colon (S), a finding suggestive of fibrous adhesions. * = follicle
 and T2-weighted (b) images show bilateral ovarian endometriomas with high signal intensity (arrows). High signal intensity on both T1- and T2-weighted images is typical of ovarian endometriomas. The interface between the right and left endometriomas is obscured (so-called kissing ovary). Low-signal-intensity stranding (arrowheads) is seen between the kissing ovary and the sigmoid colon (S), a finding suggestive of fibrous adhesions. * = follicle.")
129
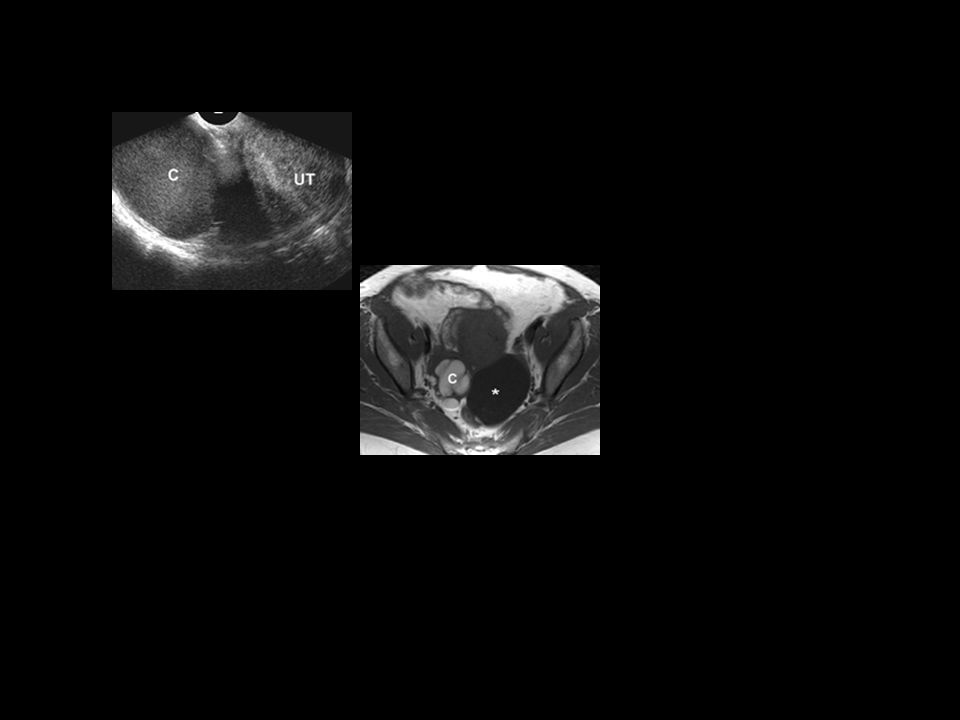
Polycystic ovarian syndrome
Polycystic ovarian syndrome. Axial T2-weighted image shows multiple tiny, hyperintense peripheral cysts (arrows) in the left ovary. The central stroma appears as a hypointense area (arrowhead). U = uterus. (Reprinted, with permission, from reference 50.)
 in the left ovary. The central stroma appears as a hypointense area (arrowhead). U = uterus. (Reprinted, with permission, from reference 50.)")
130
ydrosalpinx. Axial T2-weighted (a) and contrast-enhanced fat-suppressed T1-weighted (b) images show a cystic mass of the left adnexa (arrow). The mass has a folded (arrowheads) and tortuous appearance. Therefore, it was diagnosed as a fluid-filled dilated fallopian tube.
 and contrast-enhanced fat-suppressed T1-weighted (b) images show a cystic mass of the left adnexa (arrow). The mass has a folded (arrowheads) and tortuous appearance. Therefore, it was diagnosed as a fluid-filled dilated fallopian tube..")
131
Tubo-ovarian abscess. Axial T2-weighted (a) and contrast-enhanced fat-suppressed T1-weighted (b) images show a tortuous mass of the right adnexa. The mass consists of an ovarian abscess (short arrow) and hydrosalpinx (arrowheads), which demonstrate marked perilesion enhancement. Adenomyosis is incidentally seen in the posterior myometrium (long arrow).
 and contrast-enhanced fat-suppressed T1-weighted (b) images show a tortuous mass of the right adnexa. The mass consists of an ovarian abscess (short arrow) and hydrosalpinx (arrowheads), which demonstrate marked perilesion enhancement. Adenomyosis is incidentally seen in the posterior myometrium (long arrow)..")
132
Mature cystic teratoma in a 31-year-old woman with an elevated serum CA-125 level of 384. (a) Transabdominal US image shows an echoic mass with sound attenuation (arrow). U = uterus. (b) Contrast-enhanced CT scan demonstrates a mass with low attenuation (arrow), a finding that is diagnostic for a fat-containing lesion. U = uterus. (c) T1-weighted spin-echo MR image (600/16) demonstrates a high-signal-intensity mass in the right ovary. (d) Fat-saturated T1-weighted spin-echo MR image (500/16) demonstrates saturation of the lipid component of the mass (arrow).
 Transabdominal US image shows an echoic mass with sound attenuation (arrow). U = uterus. (b) Contrast-enhanced CT scan demonstrates a mass with low attenuation (arrow), a finding that is diagnostic for a fat-containing lesion. U = uterus. (c) T1-weighted spin-echo MR image (600/16) demonstrates a high-signal-intensity mass in the right ovary. (d) Fat-saturated T1-weighted spin-echo MR image (500/16) demonstrates saturation of the lipid component of the mass (arrow)..")
133
Borderline papillary serous tumor in a 48-year-old woman with an elevated serum CA-125 level. (a) Longitudinal US image of the right adnexa shows a cystic mass (cursors) containing a mural excrescence (arrow). (b) Doppler US image of the cyst wall shows a high-resistance waveform with a pulsatility index of 1.73, a finding that is suggestive of a benign mass. (c) Fat-saturated T1-weighted gradient-echo MR image (160/3.3 [effective]) shows excrescences (arrow) as fronds that have lower signal intensity than the cyst fluid. (d) T2-weighted MR image (4,000/126 [effective]) shows papillary projections (thick arrow) with a low-signal-intensity core (thin arrow). (e) Photomicrograph (original magnification, x40; hematoxylin-eosin stain) shows the papillary projections with a low-signal-intensity core (Cr) and edematous papillae (P)
 Longitudinal US image of the right adnexa shows a cystic mass (cursors) containing a mural excrescence (arrow). (b) Doppler US image of the cyst wall shows a high-resistance waveform with a pulsatility index of 1.73, a finding that is suggestive of a benign mass. (c) Fat-saturated T1-weighted gradient-echo MR image (160/3.3 [effective]) shows excrescences (arrow) as fronds that have lower signal intensity than the cyst fluid. (d) T2-weighted MR image (4,000/126 [effective]) shows papillary projections (thick arrow) with a low-signal-intensity core (thin arrow). (e) Photomicrograph (original magnification, x40; hematoxylin-eosin stain) shows the papillary projections with a low-signal-intensity core (Cr) and edematous papillae (P).")
134
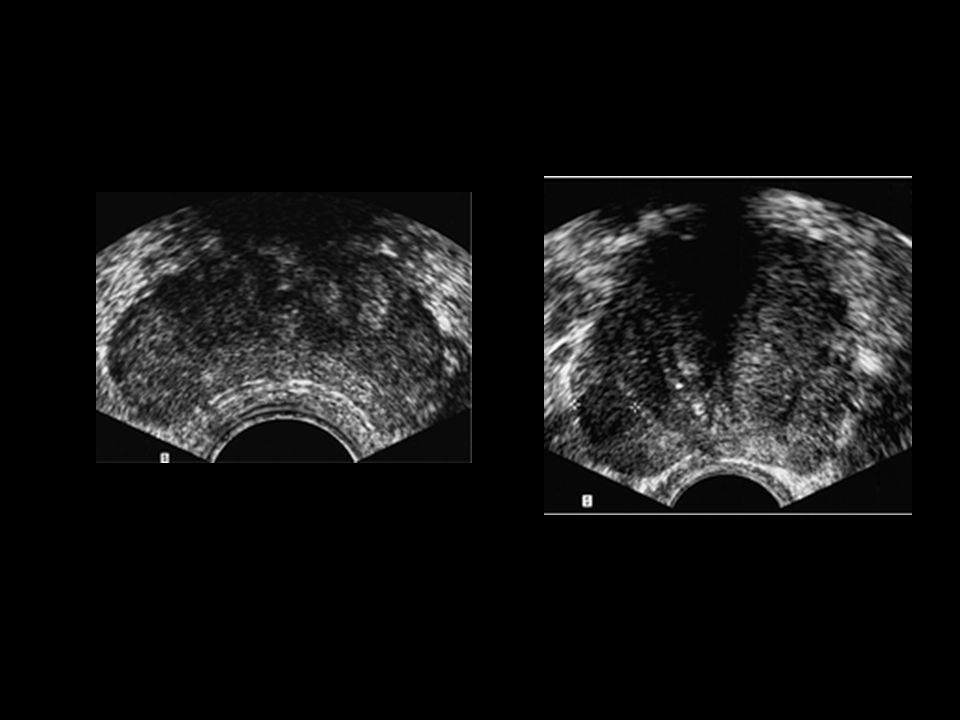
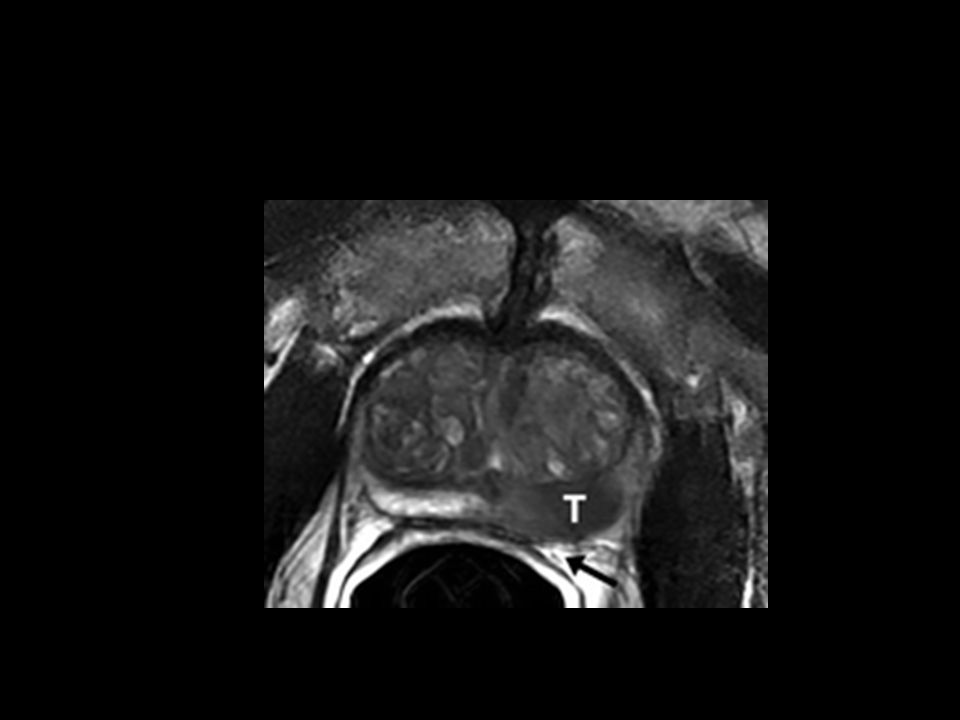
APARELHO GENITAL MASCULINO
Próstata e vesículas seminais Ecografia Suprapúbica Endocavitária RM TC- não