Carregar apresentação
A apresentação está carregando. Por favor, espere

1
Estimation of Biomass and Carbon Stocks: the Case of the Atlantic Forest
Simone Vieira Cena/USP

2
Estimation of Biomass and Carbon Stocks: the Case of The Atlantic Forest
Simone A. Vieira, Luciana F. Alves, Marcos Aidar, Luciana Spinelli Araújo, Tim Baker, João Luís F. Batista, Mariana Cruz Campos, Plinio B. Camargo, Jerome Chave, Welington B. Delitti, Niro Higuchi, Euridice Honorio, Carlos A. Joly, Michael Keller, Luiz A. Martinelli, Eduardo Arcoverde de Mattos, Thiago Metzker, Oliver Phillips, Flavio A. M. Santos, Mônica Takako Shimabukuro, Marcos Silveira, Susan E. Trumbore

3
Tropical forests are obviously a source of carbon dioxide to the atmosphere through land use change

4
and why Atlantic Forest???????
But what are the dynamics of C in intact forests and what is their potential to respond to global environmental change such as - increased CO2 - climate change - anthropogenic pressure ? and why Atlantic Forest???????

6
The Atlantic Forest 500 years ago
(1.36 million km2)
")
7
The Atlantic Forest today
(92 thousand km2)
")
9
How much C was emitted to the atmosphere due to the land use change in Atlantic forest?

10
http://www. ib. unicamp. br/destaques/biota/gradiente_funcional/index
11
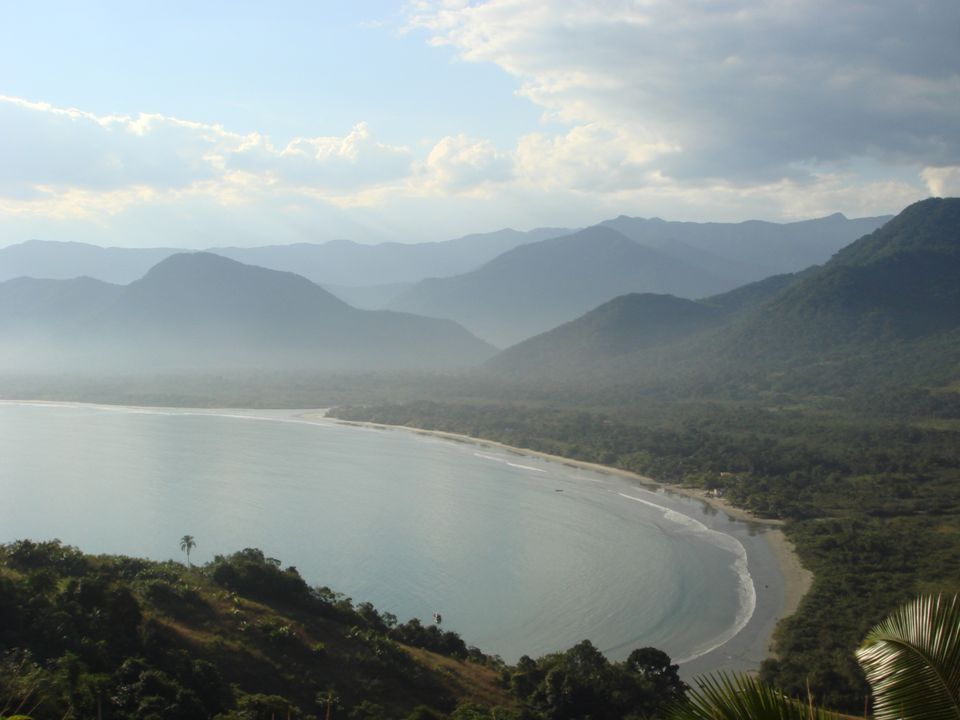
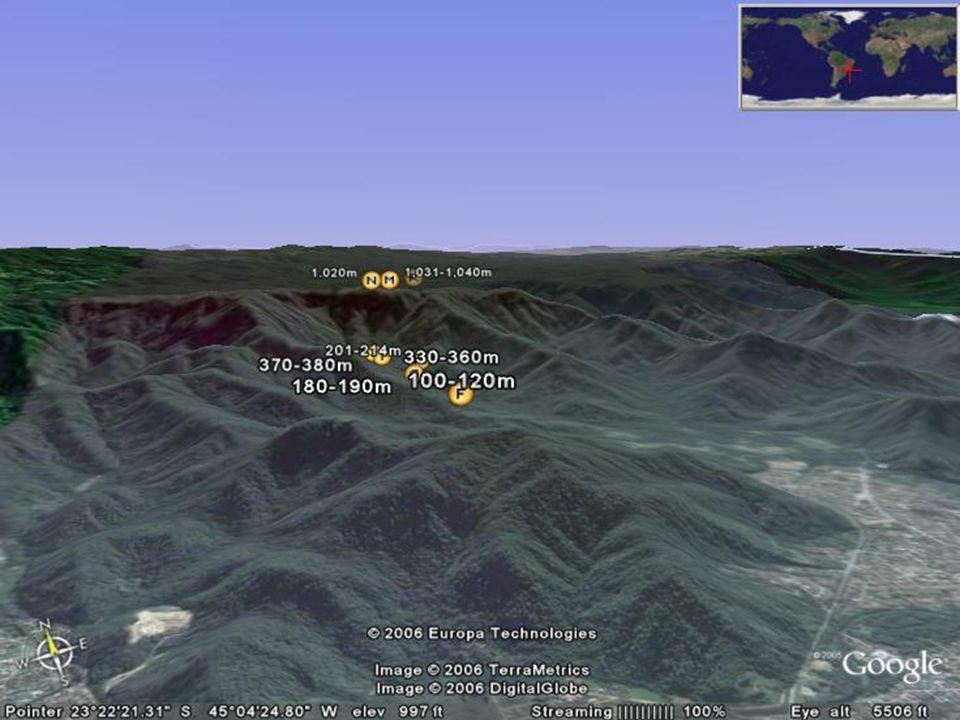
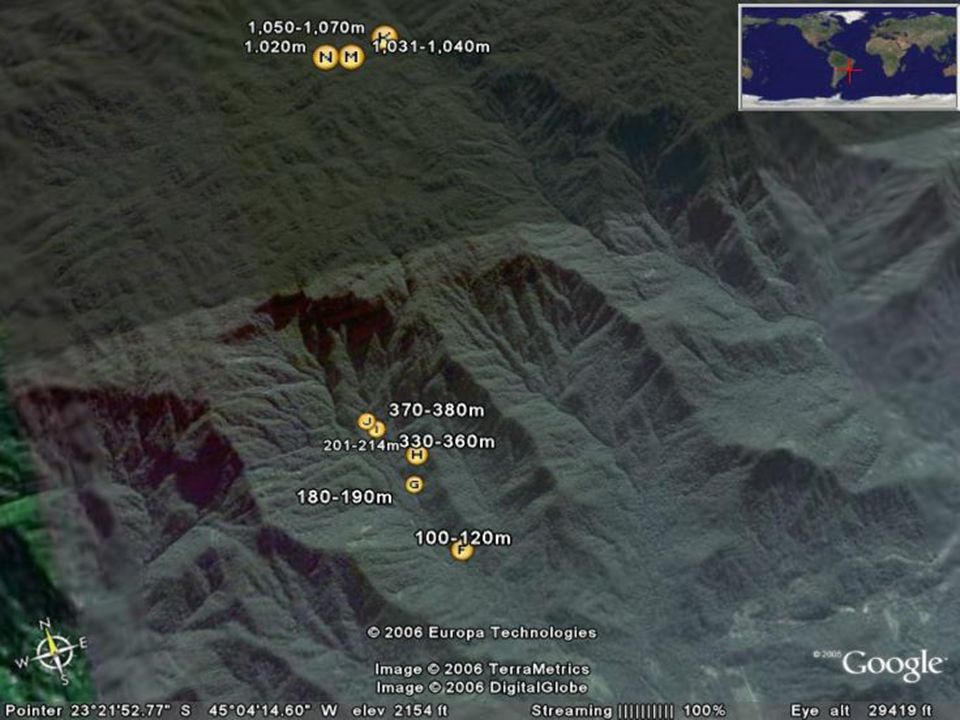
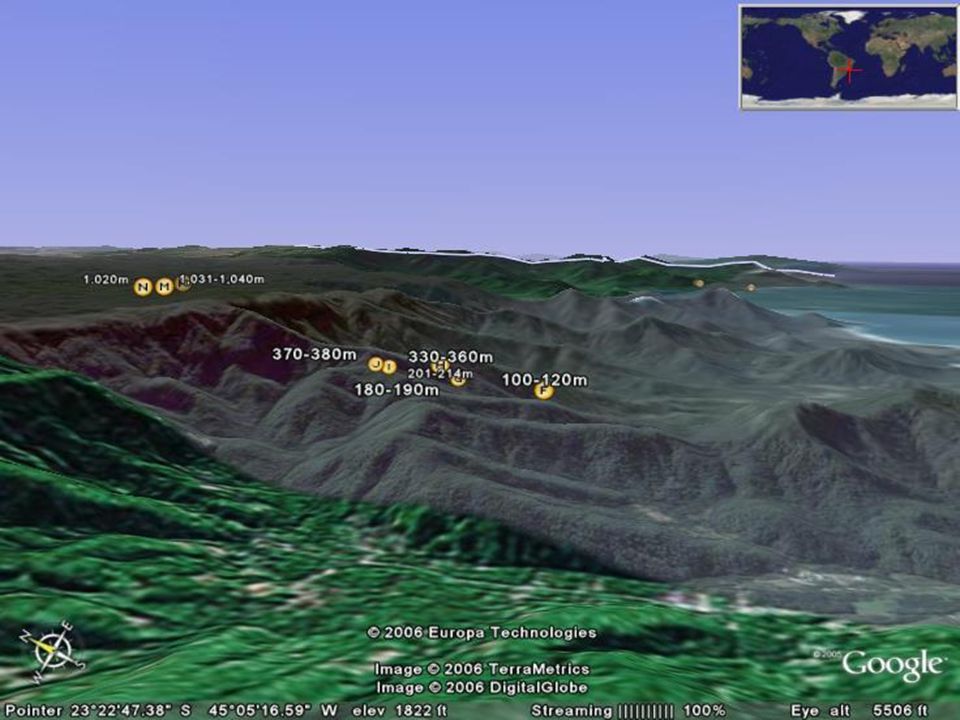
How does the structure and the function of the forest change along this altitudinal gradient?
0 m 1,000 m

12
Our questions – What is the capacity for these forests to store C? Where could it be stored and for how long? Our approach – First - Look at components of C stocks: Above and below ground and the environmental variables that control them. Use radiocarbon to determine the residence time of carbon in trees and soils

13
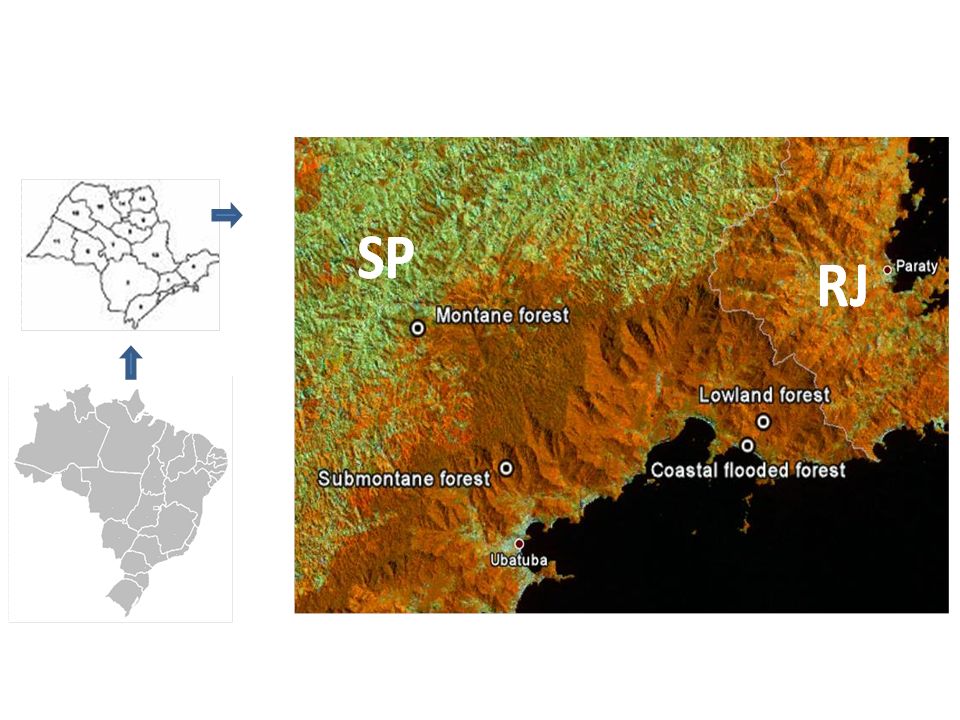
Floristic composition, structure and forest dynamics
Montane dense forest Submontane dense forest Coastal flooded forest (restinga) Lowland dense forest
 Lowland dense forest.")
16
Y X

17
Casa da Farinha Fazenda Capricórnio Sede Núcleo Santa Virgínia

21
Restinga

22
C B D E

23
G H I J F

26
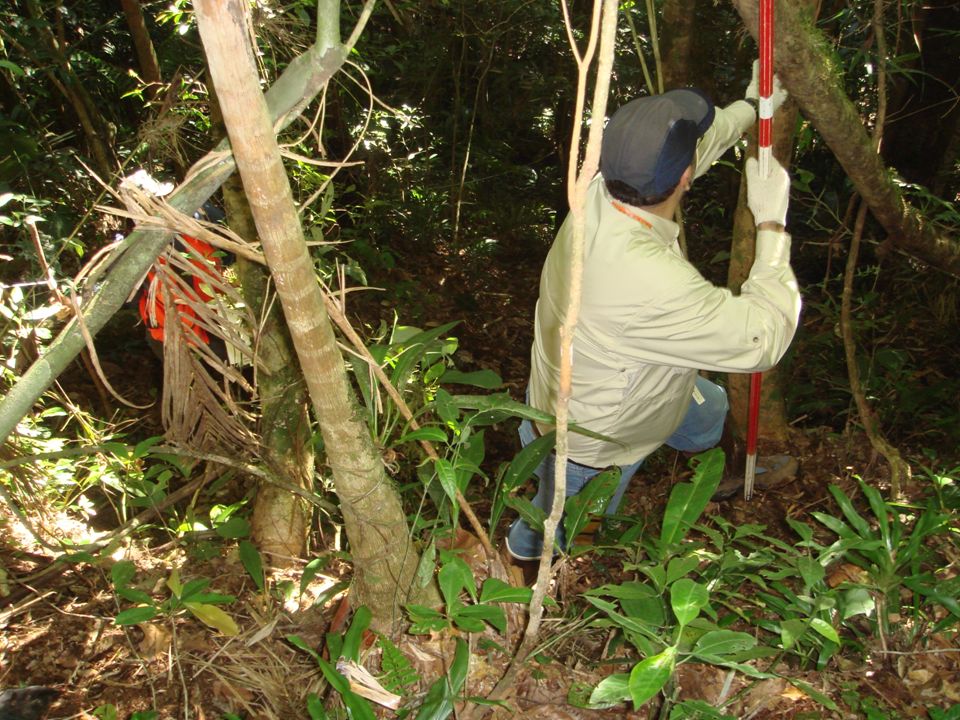
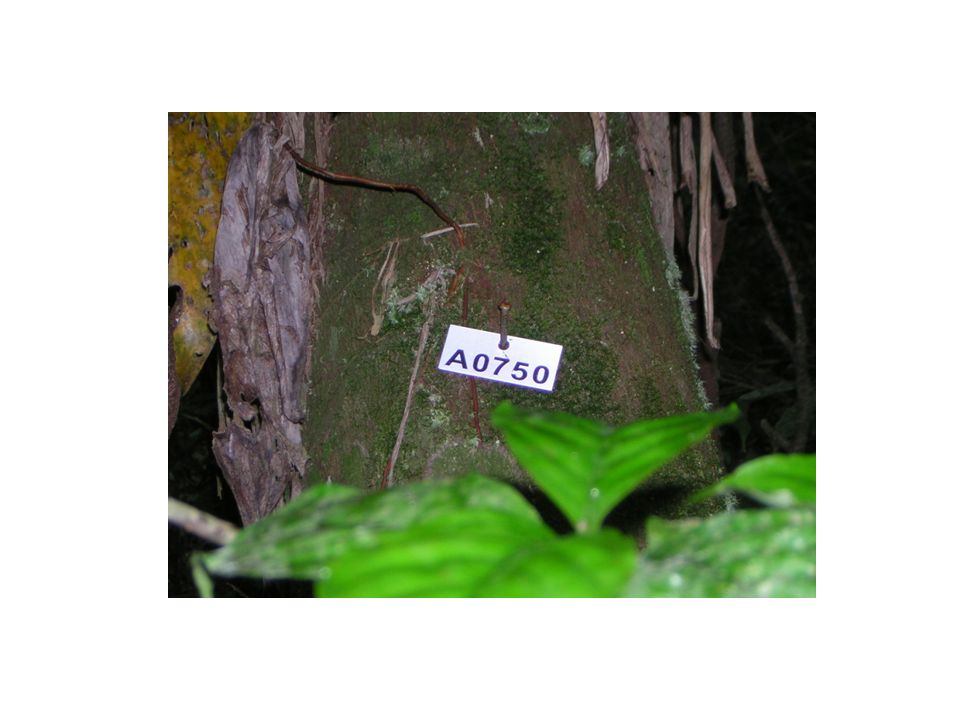
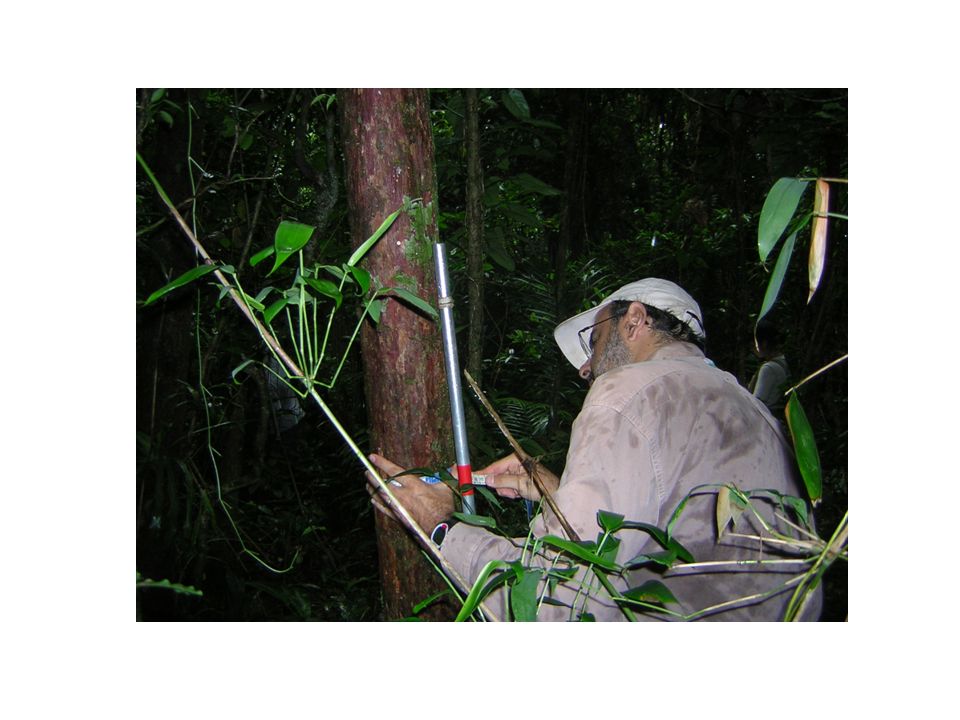
Stem information Number Location (X and Y) Identification(Floristic)
Measurement DBH (1,30m) HDBH Total Height Trunk quality Illumination of canopy Vertical trunk position
 HDBH. Total Height. Trunk quality. Illumination of canopy. Vertical trunk position.")
28
trees, palms and tree ferns
Mininum size: 4.8cm DBH

32
Propagation of error in estimating the biomass of Tropical Forest
Data quality Allometric model quality Size of the sampled area How well the plots represent the forest DBH of one tree AGB of one tree AGB of one plot AGB of the forest measurement Allometric model Sum of trees Mean of plots Chave et al. (2004)
")
33
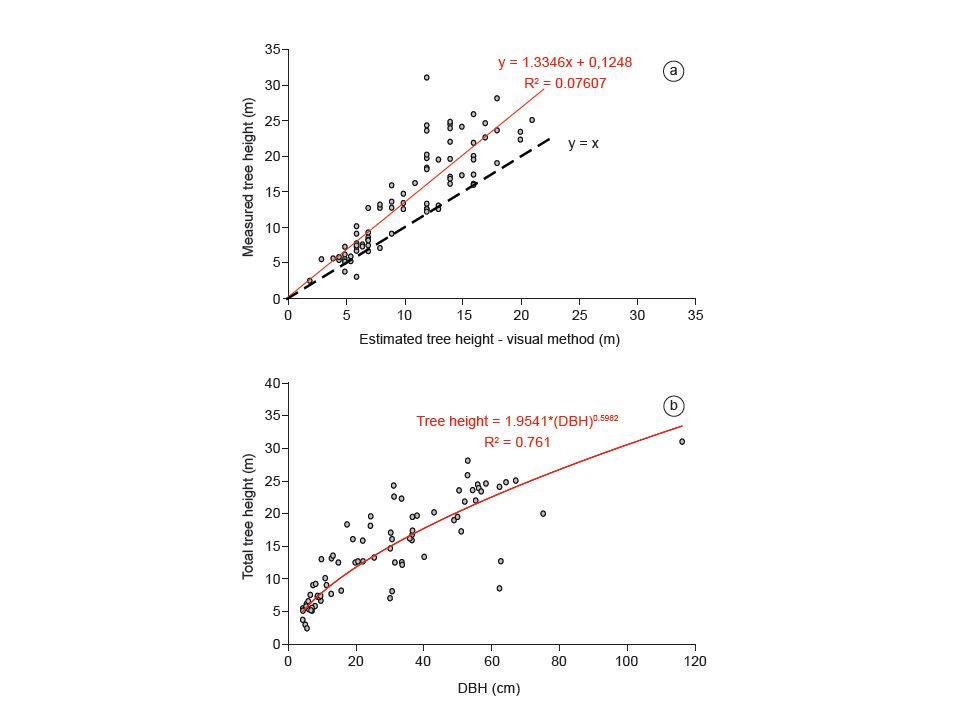
Selection and validation of models
Diameter (DBH, cm) Height (m) Wood density – specific gravity of wood (g/cm3, 15% humidity) WD: can be used in allometric equations that estimate tree biomass and carbon stocks from stem diameter values - to reduce uncertainties. Fonte:
 Height (m) Wood density – specific gravity of wood (g/cm3, 15% humidity) WD: can be used in allometric equations that estimate tree biomass and carbon stocks from stem diameter values - to reduce uncertainties. Fonte:")
34
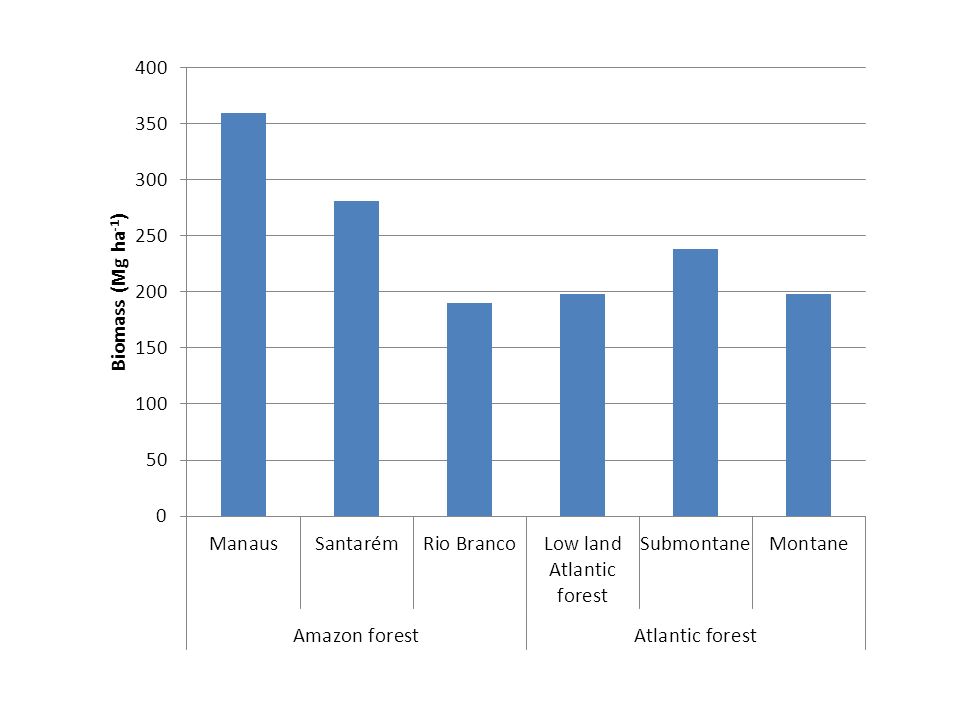
Atlantic Forest Above ground biomass
Tiepolo et al. (2002) – Guaraqueçaba (PR) Burguer (2005) – Santos (SP) Rolim et al. (2005) – Linhares (ES)
 – Guaraqueçaba (PR) Burguer (2005) – Santos (SP) Rolim et al. (2005) – Linhares (ES)")
35
Allometric model – trees Dry biomass above ground (kg ha-1)
Modelos alométricos utilizados para estimativa da biomassa seca viva acima do solo (kg ha-1) de árvores neste estudo, baseados em DAP, DAP e altura (H), e DAP, H e densidade da madeira (r).
 de árvores neste estudo, baseados em DAP, DAP e altura (H), e DAP, H e densidade da madeira (r).")
36
Allometric model – other life forms
Modelos alométricos utilizados para estimativa da biomassa seca viva acima do solo (kg ha-1) de árvores neste estudo, baseados em DAP, DAP e altura (H), e DAP, H e densidade da madeira (r).
 de árvores neste estudo, baseados em DAP, DAP e altura (H), e DAP, H e densidade da madeira (r).")
37
Tree total height x DBH in Amazon forest (western Amazon) and Atlantic forest (Picinguaba).
 and Atlantic forest (Picinguaba).")
38
Scaranello (2007)
")
40
Above ground biomass (Mg/ha)
Submontane dense forest

41
Forest Structure ca.22,000 tree stems > 4.8 cm DBH
Dens = 1477 180 ind ha-1 ( CI 95%) BA = 34.0 4.1 m2 ha-1 > 10 cm DBH - change between altitudinal density 25% Basal area– 69% biomass – 30% Em 11 hectares, foram amostrados cerca de 16 mil ind. Os resultados iniciais, comparando diferentes áreas ao longo de um gradiente altitudinal, revelaram diferenças importantes na ditribuição da biomassa relacionadas à variação na estrutura florestal.
 BA = 34.0 4.1 m2 ha-1. > 10 cm DBH - change between altitudinal. density 25% Basal area– 69% biomass – 30% Em 11 hectares, foram amostrados cerca de 16 mil ind. Os resultados iniciais, comparando diferentes áreas ao longo de um gradiente altitudinal, revelaram diferenças importantes na ditribuição da biomassa relacionadas à variação na estrutura florestal.")
42
Altitude A distribuição das principais formas de vida não foi similar entre as diferentes fitofisionomias, contribuindo para a variação na estrutura florestal. Um dos plots (F) is remarkably different, showing a high number of tree ferns and a low number of palms per hectare. Recently, old residents have reported that the area had been logged years ago. The farm owners logged a timber species, Hieronyma alchorneoides.
 is remarkably different, showing a high number of tree ferns and a low number of palms per hectare. Recently, old residents have reported that the area had been logged years ago. The farm owners logged a timber species, Hieronyma alchorneoides.")
43
Total Above Ground Biomass
> 30 cm 74% Altitude 71% 69% maiores valores de biomassa para as áreas de FOD Submontana, seguido pela Montana, e os menores valores, para a Restinga. 47%

44
Biomassa (viva e morta) e caules múltiplos
Biomassa (viva e morta) e caules múltiplos. Poucos parâmetros estruturais coletados com acurácia e precisão, e a inclusão de todas as formas de vida de porte arbóreo mais abundantes na FOD Atlântica foram importantes para identificar variações estruturais entre as fitofisionomias, apesar de serem dados estáticos.
 e caules múltiplos. Poucos parâmetros estruturais coletados com acurácia e precisão, e a inclusão de todas as formas de vida de porte arbóreo mais abundantes na FOD Atlântica foram importantes para identificar variações estruturais entre as fitofisionomias, apesar de serem dados estáticos.")
45
Forest Structure implications to carbon stocks

46
Forest structure and biomass
Disturbance Edaphic factors Forest structure and biomass Residence time and forest dynamic Perturbações e a fatores edáficos são fatores importantes que podem afetar a densidade e biomassa em uma mesoescala O foco das pesquisas deve estar na compreensão de como a perturbação (nat e ant) e os fatores edáficos afetam a distribuição da biomassa na FOD Atlântica. Entretanto, se existem diferenças na distribuição dessa biomassa entre as classes de tamanho e formas de vida, é essencial conhecer a dinâmica da floresta. Só assim, vamos obter estimativas do tempo de residência do C e os fluxos de C para a atmosfera, e entender a influência da perturbação (natural e antrópica) no funcionamento deste ecossistema. Temos agora a oportunidade de monitorar e comparar a estrutura florestal e eventos de perturbação, através da realização de novos inventários. Carbon stock
 e os fatores edáficos afetam a distribuição da biomassa na FOD Atlântica. Entretanto, se existem diferenças na distribuição dessa biomassa entre as classes de tamanho e formas de vida, é essencial conhecer a dinâmica da floresta. Só assim, vamos obter estimativas do tempo de residência do C e os fluxos de C para a atmosfera, e entender a influência da perturbação (natural e antrópica) no funcionamento deste ecossistema. Temos agora a oportunidade de monitorar e comparar a estrutura florestal e eventos de perturbação, através da realização de novos inventários. Carbon stock.")
48
Biomass distribution in DBH size class
Dry season Biomass distribution in DBH size class

49
Biomass distribution in DBH size class
Altitudinal Position

50
Spatial patterns in carbon storage above and belowground in Brazilian Tropical Forest: Amazon and Atlantic Forest 13 *109 MgC ha-1

51
http://www. ib. unicamp. br/destaques/biota/gradiente_funcional/index
Financiamento Este trabalho foi financiado pela Fundação de Amparo à Pesquisa do Estado de São Paulo (FAPESP) no âmbito do Projeto Temático Gradiente Funcional (Processo 03/ ), que faz parte do Programa BIOTA/FAPESP - O Instituto Virtual da Biodiversidade ( Autorização COTEC/IF /2005 e autorização IBAMA/CGEN 093/2005.
 no âmbito do Projeto Temático Gradiente Funcional (Processo 03/ ), que faz parte do Programa BIOTA/FAPESP - O Instituto Virtual da Biodiversidade ( Autorização COTEC/IF /2005 e autorização IBAMA/CGEN 093/2005.")
Apresentações semelhantes


>")


 SEGUNDO NOVOS ESTRATOS VITÓRIA, ES – OUTUBRO 2008 Kenneth Camargo – IMS/UERJ Cláudia Medina – IESC/UFRJ.>")

 bilhões de pessoas não tem acesso a água de qualidade adequada ao consumo 2,4 (40%) bilhões de pessoas não tem acesso as condições básicas de.>")


