Carregar apresentação
A apresentação está carregando. Por favor, espere

1
JAPÃO + BRASIL COOPERAÇÃO AGRONEGÓCIO BRASILEIRO
ALAVANCA DO DESENVOLVIMENTO OPORTUNIDADES E DESAFIOS JAPÃO + BRASIL COOPERAÇÃO AVALIAÇÕES TÉCNICAS SETEMBRO DE 2015 1

2
AGRONEGÓCIO BRASILEIRO EVOLUÇÃO
HÁ 50 ANOS = IMPORTADOR HÁ 20 ANOS = VENDEDOR HOJE = FORNECEDOR DISPUTADO 2020 MAIOR SUPRIDOR DO MERCADO MUNDIAL DE EXPORTAÇÕES A NOVA GEOGRAFIA DA PRODUÇÃO

3
Brasil - Ranking Mundial (2014 / 2015) Part. no Comércio Internacional
Principais Produtos Ranking Mundial Part. no Comércio Internacional Produção Exportação Açúcar 1º 45% Café 28% Suco de laranja 77% Carne bovina 2º 22% Carne de frango 35% Soja em grãos 39% Milho 3º 17% Óleo de soja 4º 12% Farelo de soja Carne suína 10% Algodão 5º Fonte: USDA - Observação: Dados relativos ao ano de 2014 e 2015

4
(EUA+ BRASIL+ ARGENTINA)
Estimativas – Soja – Safra 2013/14 em milhões de toneladas – valores aproximados SOJA Produção % Consumo Exportação MUNDO 287,7 100% 269,3 109,3 ** EUA* 89,5 31% 49,0 18% 41,1 38% BRASIL 90,0 40,4 15% 45,0 41% ARGENTINA* 54,0 19% 38,6 14% 8,0 7% TOTAL (EUA+ BRASIL+ ARGENTINA) 233,5 81% 127,9 48% 94,1 86% * Fronteira agrícola em fase de esgotamento ** Estimativa de exportações em 2020 = 140 milhões/t FONTE: Base USDA – Relatório WASDE (Fevereiro/2014)
 233,5. 81% 127,9. 48% 94,1. 86% * Fronteira agrícola em fase de esgotamento. ** Estimativa de exportações em 2020 = 140 milhões/t. FONTE: Base USDA – Relatório WASDE (Fevereiro/2014)")
5
RAZÕES DO DESEMPENHO CRESCIMENTO POPULACIONAL
80 MILHÕES ANO MELHORIA DO NIVEL DE RENDA EQUIVALENTE A 100 MILHÕES ANO FALTA DE TERRAS ADEQUADAS ENTRESSAFRA DO NORTE CAPACIDADE DOS PRODUTORES

7
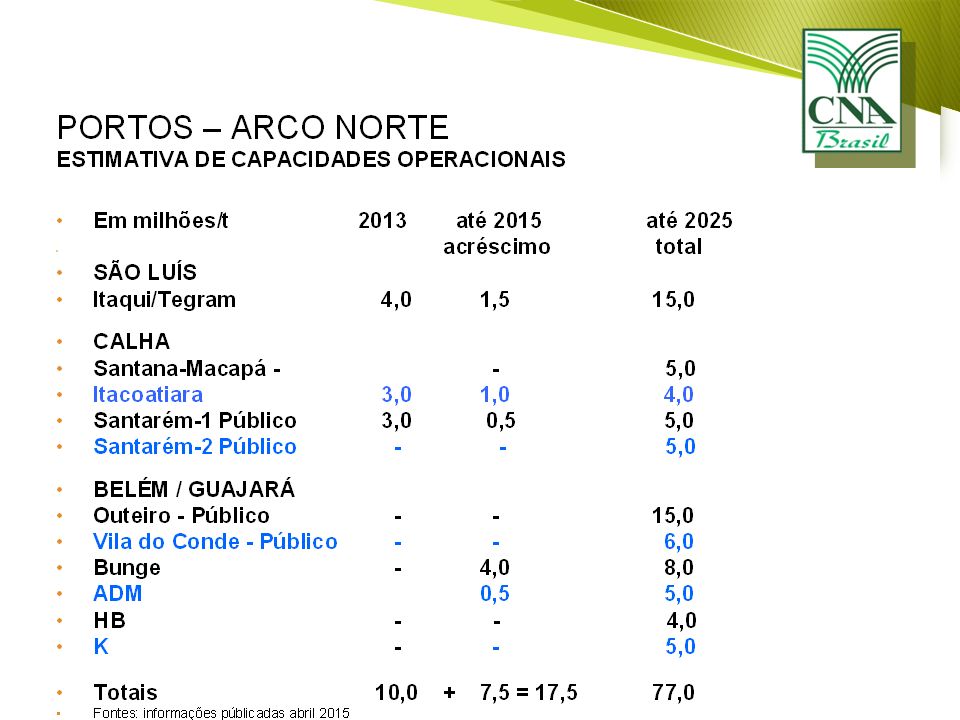
Produção e Escoamento Complexo de Soja e Milho: avaliação

8
Comparativo - Custos Lavoura/Porto
US$ / TON Fonte : ANEC

9
EXPORTAÇÕES 2014 Participações principais
Produto Valor US$ Bilhões Preço Médio (US$ ton) Complexo Soja 31,40 517,26 Minério de Ferro 25,81 74,97 Carnes 17,43 2.730,99 Complexo Sucroalcooleiro 10,36 410,44 Produtos Florestais 9,95 580,27 Café 6,66 3.217,64 Milho 3,87 188,80 Couros e seus produtos 3,45 6.728,38 Fumo e Seus Produtos 2,50 5.254,62 Sucos 1,96 1.019,63 Frutas 0,84 1.146,61 Fonte: Agrostat/MAPA e AliceWeb / MDIC.
 Complexo Soja. 31, ,26. Minério de Ferro. 25,81. 74,97. Carnes. 17, ,99. Complexo Sucroalcooleiro. 10, ,44. Produtos Florestais. 9, ,27. Café. 6, ,64. Milho. 3, ,80. Couros e seus produtos. 3, ,38. Fumo e Seus Produtos. 2, ,62. Sucos. 1, ,63. Frutas. 0, ,61. Fonte: Agrostat/MAPA e AliceWeb / MDIC.")
10
BRASIL - VISÃO ESTRATÉGICA
Exportações do agronegócio, alavanca para o desenvolvimento interno Dependência mundial Posição do País no contexto internacional

11
LUIZ ANTONIO FAYET Comissão de Infraestrutura e Logística

12
DADOS AUXILIARES

13
Novas Rotas de Escoamento – corredores Norte

Apresentações semelhantes


; anterior jul-11 (US$>")


. Balanço Mundial.>")


