Carregar apresentação
A apresentação está carregando. Por favor, espere

1
3 “Game Changers” 1- Change in Demography (we are getting older) 2- The Scientific and Technological revolution 3- Environmental disruption, namely Climate Change, loss of Biodiversity, pollution of the Sea Carlos Pimenta
 2- The Scientific and Technological revolution 3- Environmental disruption, namely Climate Change, loss of Biodiversity, pollution of the Sea Carlos Pimenta")
2
População portuguesa Actual10.389.711 Nascimentos Óbitos 201 240 Saldo migratório -55

3
An unparalleled technological and scientific revolution New matter New “Life” Health, longevity and demography revolution Real-time decentralized data processing Participated Globalization wit millions of users Dematerialization New energy forms A basic 3D printer, also known as a fabricator or “fabber”, now costs less than a laser printer did in 1985

4
3D Printing grew 40% in 2013 Siemens: to cut time of order from 44 weeks to 4 to replace turbine blades! And prototyping from 20 weeks to 48 hours”. GE: is using 3D printing for Boeing 737 and Airbus A320 fuel nozzles 25% lighter and 5 times more durable! Airbus: is making bits of planes and dreams of printing the entire fuselages! http://www.theverge.com/2014/8/13/5999933/robots-taking-jobs-video

5
Technology and jobs Coming to an office near you The effect of today’s technology on tomorrow’s jobs will be immense—and no country is ready for it Jan 18th 2014 | From the print edition INNOVATION, the elixir of progress, has always cost people their jobs. In the Industrial Revolution artisan weavers were swept aside by the mechanical loom. Over the past 30 years the digital revolution has displaced many of the mid- skill jobs that underpinned 20th-century middle- class life. Typists, ticket agents, bank tellers and many production-line jobs have been dispensed with, just as the weavers were. For those, including this newspaper, who believe that technological progress has made the world a better place, such churn is a natural part of rising prosperity. Although innovation kills some jobs, it creates new and better ones, as a more productive society becomes richer and its wealthier inhabitants demand more goods and services. A hundred years ago one in three American workers was employed on a farm. Today less than 2% of them produce far more food. The millions freed from the land were not consigned to joblessness, but found better-paid work as the economy grew more sophisticated. Today the pool of secretaries has shrunk, but there are ever more computer programmers and web designers.

6
Source: http://www.nytimes.com/2012/07/30/opinion/the- conversion-of-a-climate-change- skeptic.html?_r=3&pagewanted=all& “Our results show that the average temperature of the earth’s land has risen by two and a half degrees Fahrenheit over the past 250 years, including an increase of one and a half degrees over the most recent 50 years. Moreover, it appears likely that essentially all of this increase results from the human emission of greenhouse gases.” Prof Richard A. Muller University of California, Berkeley OP-ED CONTRIBUTOR The Conversion of a Climate-Change Skeptic By RICHARD A. MULLER Published: July 28, 2012 Global land temperatures have increased by 1.5 degrees Celsius over the past 250 years 1.6 billion meteorological records Sources: http://berkeleyearth.org/results-summary/

7
“The carbon dioxide emitted today will affect the planet for hundreds of thousands of years; If humanity continues to spew greenhouse gases into the air at the current rate, we will re-create the hot, wet conditions of the Cretaceous era, some 100 million years ago; At present, humanity is altering the climate 5,000 times faster than the pace of the most rapid natural warming episode in our planet’s past.” Prof Ken Caldeira in Scientific American 8/2012 Standford University, California Source: http://www.scientificamerican.com/article.cfm?id=how-far-can-climate-change-go LONG TERM EFFECTS

8
In 2011 the Northwest Passage was ice free for the first-time ever since records are made Source: Project CLAMER – Climate Change and European Marine Ecosystem Research http://www.clamer.eu/images/stories/press_releases/CLAMER_Press_release2_2011 -06-27.pdf First evidence of a trans-Arctic migration in modern times was recently disclosed by project CLAMER when a tiny species of plankton (Neodenticula seminae) found only in the Pacific, was discovered in the North Atlantic in 2011, where it has been extinct for 800.000 years.
 found only in the Pacific, was discovered in the North Atlantic in 2011, where it has been extinct for years.")
9
Still more than 1.500 million people outside the commercial energy market. 1- CO2 (decarbonisation) 2- shale gas. USA. Is now the most important natural gas producer 3- 2004 was thought price of oil was going to stay around 20Usd / Barrel. The same for other commodities, but... China, Brics, etc. all raw materials went up. NOW (2014/15) THEY go down, but… 4- TICs (Tecnologias de Informação e Comunicação ) 5- Energy Efficiency 6- Renewables and Distributed electricity generation SMART AND INTERCONNECTED GRIDS 7- Electric mobility and batteries (Distributed electricity storage) 8- A world of Prosumers
 2- shale gas. USA. Is now the most important natural gas producer was thought price of oil was going to stay around 20Usd / Barrel. The same for other commodities, but... China, Brics, etc. all raw materials went up. NOW (2014/15) THEY go down, but… 4- TICs (Tecnologias de Informação e Comunicação ) 5- Energy Efficiency 6- Renewables and Distributed electricity generation SMART AND INTERCONNECTED GRIDS 7- Electric mobility and batteries (Distributed electricity storage) 8- A world of Prosumers.")
11
A política energética tem de considerar vários objectivos Reduzir dependência energética Diversificar mix energético Criar mecanismos para promover investimento Promover a utilização de recursos endógenos Abrir mercados energéticos europeus Mitigar impacto do aumento dos preços de energia Manter Europa na frente da inovação tecnológica Promover renováveis e tecnologias com baixas emissões Aumento da eficiência energética Reduzir emissões Sustentabilidade Segurança de abastecimento Competitividade Daqui decorre que uma política que não defenda as renováveis e menospreze a dependência dos combustíveis fósseis não possa cumprir com estes objectivos 11

12
Segurança do Abastecimento Garantir as necessidades finais em termos de quantidade e qualidade Não só pela gestão da oferta: há escolhas + eficientes ao longo da cadeia Ambiente e Sustentabilidade Local/regional Global (CO2) – um factor incontornável! Competitividade da Economia Que contas fazemos? Verdade, transparência, factores de distorção, limitações da regulação... Economia do CO2 ? Objectivos de Política Energética

13
The Resilience Factor: Conventional energy systems accidents/incidents that have huge global impacts – environment/health, markets/prices, availability “… The BP oil spill in the Gulf Coast is the worst environmental disaster of its kind in our nation‘s history(…) We are working to hold BP accountable for the damage to the lands and the livelihoods of the Gulf Coast, and we are taking strong precautions to make certain a spill like this never happens again.” Barack Obama 14-June-2010
 We are working to hold BP accountable for the damage to the lands and the livelihoods of the Gulf Coast, and we are taking strong precautions to make certain a spill like this never happens again. Barack Obama 14-June-2010")
14
Biodiversity Loss

15
Air pollution and health problems in emerging economies Chinese officials have shut down factories and ordered cars off the roads to try and save their capital city after spending three straight days under a cloud of toxic smog. Visibility has been as low as 100 yards in some parts of the city, as an increase in winter coal burning, combined with low wind conditions pushed the nation's already crushing pollution problems to dangerous levels. To put the current crisis in perspective, the World Health Organization considers an acceptable level of airborne particulates to be 25 micrograms per cubic meter (μg/m3). On Saturday, readings in Beijing reached 993 μg/m3. The head of cardiology at Peking University People’s Hospital said "The number of people coming into our emergency room suffering heart attacks has roughly doubled since Friday." Source: http://www.theatlanticwire.com/global/2013/01/beijings-pollution-problem-gets-out-hand/60943/
. On Saturday, readings in Beijing reached 993 μg/m3. The head of cardiology at Peking University People’s Hospital said The number of people coming into our emergency room suffering heart attacks has roughly doubled since Friday. Source:")
16
Metas Europeias para 2030: meta vinculativa de, pelo menos, 40% de redução de emissões de gases com efeito de estufa, em comparação com os valores de 1990; meta vinculativa de pelo menos 27% de renováveis no consumo de energia; meta indicativa de pelo menos 27% para o aumento da eficiência energética; meta indicativa de 15% de interligações elétricas.

17
Progressão e domínio das energias renováveis na nova capacidade instalada As novas centrais renováveis substituem centrais térmicas obsoletas (carvão e nuclear) Evolução futura: continuação do crescimento a nível mundial Fonte: Wind in Power 2009 European Statistics EWEA 2009 2009
 Evolução futura: continuação do crescimento a nível mundial Fonte: Wind in Power 2009 European Statistics EWEA")
18
18 energia primária (oferta) energia útil (procura) Electricidade 20 a 25% hidro biomassa vento sol geotermia petróleo carvão gás nuclear iluminação multimédia ventilação arrefecimento aquecimento água quente Indústria Mobilidade Outros sistemas de transformação e transporte Energia final
 energia útil (procura) Electricidade 20 a 25% hidro biomassa vento sol geotermia petróleo carvão gás nuclear iluminação multimédia ventilação arrefecimento aquecimento água quente Indústria Mobilidade Outros sistemas de transformação e transporte Energia final")
19
EN. PRIMÁRIAEN. FINAL EN. ÚTIL E. útil representa apenas 38% da E. primária e E. térmica representa 46% da E. útil As autarquias ao facilitarem a mobilidade e ao prestarem maior atenção à qualidade do edificado estão a melhorar a qualidade de vida dos seus cidadãos e a reduzir os respetivos custos na vertente da energia Matriz AMP-ND (Grande Porto) A Economia Verde no Edificado
 A Economia Verde no Edificado.")
20
Novas fontes (eólica, sol, biomassa…) Redes Armazenamento Monitorização, controlo EXPO’98 Covenant of Mayors 20 x 20 x 20 da EC Mercados Actividades económicas at large Substituição da electricidade para usos de calor por GN, sol, biomassa,.. Subst. de fuels por electricidade (mobilidade) TecnologiaGestão da Procura‘Vector shifting’ oferta + procura procura + tecnologia oferta (preços/…)+ procura Cidades ( planeamento urbano, mobilidade, edificação, actividades produtivas, espaços abertos,…) Sectores de actividade sistemas energéticos (smart metering, co-geração, …) Sol vs gás Sol vs electricidade Gás vs electricidade Biomassa vs electricidade Electricidade vs combustíveis Edifícios como ‘suntraps! – EPB Directive Mobilidade Cidades at large
 TecnologiaGestão da Procura‘Vector shifting’ oferta + procura procura + tecnologia oferta (preços/…)+ procura Cidades ( planeamento urbano, mobilidade, edificação, actividades produtivas, espaços abertos,…) Sectores de actividade sistemas energéticos (smart metering, co-geração, …) Sol vs gás Sol vs electricidade Gás vs electricidade Biomassa vs electricidade Electricidade vs combustíveis Edifícios como ‘suntraps. – EPB Directive Mobilidade Cidades at large.")
21
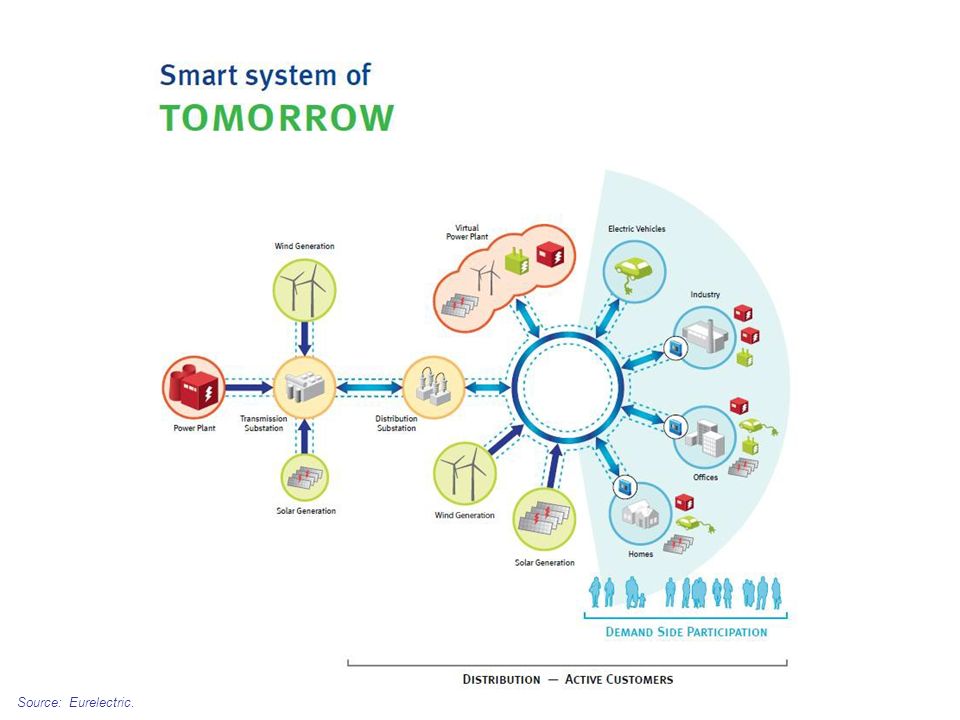
Passado Futuro: produção distribuída com gestão inteligente do sistema com grande flexibilidade Central power station House Factory Commercial building Transmission Network Distribution Network Storage Photovoltaics power plant Wind power plant House with domestic CHP Power quality device Storage Local CHP plant Storage Power quality device Flow Control

22
22 Ventominho 240MW

24
19 fábricas construídas ou ampliadas entre 2007 e 2010 ENERCON Pás de Rotor (1, 12, 13) – ENERCON Torres de Betão (5, 7, 9) – ENERCON Geradores Síncronos (10) – SAERTEX Fibra de Vidro (11) – A. SILVA MATOS Torres de Aço (3, 6, 15) – SIEMENS Transformadores e Quadros de Média Tensão (8, 14) – JAYME DA COSTA Equipamentos Eléctricos (4)
 – SIEMENS Transformadores e Quadros de Média Tensão (8, 14) – JAYME DA COSTA Equipamentos Eléctricos (4).")
25
Mais de 1950 postos de trabalho industriais criados em tempos de crise económica 0 50 0 100 0 200 6 200 7 200 8 200 9 201 0 201 1 201 2 201 3 Novos postos de trabalho criados nas empresas do cluster 2000 Empresa s Cluster Fábricas ENEOP 1500

26
Valor Acrescentado Nacional: cerca de 300 milhões de euros por ano Emprego em zonas desfavorecidas: O pólo industrial é o motor da criação de emprego na região de Viana do Castelo, que sofreu duramente com as desindustrialização (crise dos Estaleiros Navais…) Distribuição de riqueza em zonas rurais: Receitas dos municípios5 milhões € / ano Rendas dos proprietários dos terrenos3,4 milhões € / ano VAB do cluster em ano cruzeiro~ 120 milhões € / ano VAB dos parques eólicos~ 170 milhões € / ano Efeito sobre o PIB regional (MINHO-LIMA): O cluster representa cerca de 4% do PIB d a região Minho-Lima Um impacte notável na economia nacional e regional
 Distribuição de riqueza em zonas rurais: Receitas dos municípios5 milhões € / ano Rendas dos proprietários dos terrenos3,4 milhões € / ano VAB do cluster em ano cruzeiro~ 120 milhões € / ano VAB dos parques eólicos~ 170 milhões € / ano Efeito sobre o PIB regional (MINHO-LIMA): O cluster representa cerca de 4% do PIB d a região Minho-Lima Um impacte notável na economia nacional e regional")
27
Carga que pode ser reduzida Flexibilidade do Sistema → Smart Grids → Smart Meters → Demand Side Management → Veículos Eléctricos Importante papel das TICs Fonte: INESC Porto

28
Previsão Eólica actualizada cada 6 horas Ferramentas de previsão sofisticadas Fonte REN

29
Nuclear Energy Usually presented as a: Cheap and clean source of electricity A solution for hydrogen production However Costs of new plants are grossly and repeatedly underestimated Nuclear faces prohibitively high—and escalating—capital costs Several costs (like dismantling) are usually unaccounted for Blackmailing taxpayers: projects too big too fail Global security and risks of nuclear proliferation Radioactive waste: a dangerous heritage with no solution and a long life Risk of accidents is underestimated Lack of transparency from authorities in the case of an incident/accident Pressure on natural resources like water (impact of water shortages) Dependency on imported uranium Lack of fuel for existing plants from 2025 onwards Nuclear is already a mature technology—it will not get cheaper Nuclear subsidies take money away from more effective alternative energy subsidies Other clean energy technologies are cheaper, cleaner, safer and faster to build
 are usually unaccounted for Blackmailing taxpayers: projects too big too fail Global security and risks of nuclear proliferation Radioactive waste: a dangerous heritage with no solution and a long life Risk of accidents is underestimated Lack of transparency from authorities in the case of an incident/accident Pressure on natural resources like water (impact of water shortages) Dependency on imported uranium Lack of fuel for existing plants from 2025 onwards Nuclear is already a mature technology—it will not get cheaper Nuclear subsidies take money away from more effective alternative energy subsidies Other clean energy technologies are cheaper, cleaner, safer and faster to build")
30
Source: ttp://www.timera-energy.com/uk-gas/all-shook-up-over-shale-gas/

31
"The market for large power plants will never return" Europe’s energy sector predicts its future 09/06/2014 If we take the opinions of these industry professionals as read, Europe’s future power sector will be decentralized, with big utilities going the way of the dinosaur. The future EU electricity market will combine regulated and open elements. Fossil fuel fired power plants will continue to back up intermittent renewable generation as Europe moves, at a slower and steadier pace, toward a low-carbon future; Costs for renewables will continue to fall, and energy storage will increasingly come into play.

32
Generated by CamScanner from intsig.com

33
Non-energy companies in the business

34
Non-finance companies in the business Walmart working towards 100% renewable energy. Essent (NL belonging to RWE), made a deal with Mediamarkt to sell energy through its shops for five years in the Netherlands.
, made a deal with Mediamarkt to sell energy through its shops for five years in the Netherlands..")
35
All-Electric plug-in is Car of the Year 2013 Motor Trend Magazine Automobile Magazine Consumer Reports.org

36
Personal wi-fi wireless controlled lighting

37
…and utilities in non-utilities business My vision, he said, “is that RWE will putsolarpanels onyour roof, a battery in your shed, a heatpumpin yourcellar,andwe will alsomanagethiscomplex energy system for you.” CEO of RWE, Peter Terium in Energy Post, 7 April 2014.

38
Source: Eurelectric.

40
and Financial innovation!

41
Política Energética: Um possível VADEMECUM Prospectiva e inovação em energia adaptadas ao nosso país. Promoção da mobilidade eléctrica Bom funcionamento dos Mercados da electricidade, do gás natural e dos combustíveis, assegurando uma liberalização efectiva, regulação independente e internalização dos custos ambientais, nomeadamente os relativos ao CO2 Continuidade do programa das energias renováveis na vertente da electricidade e dinamização da vertente calor (solar, biomassa de proximidade, geotermia). Promoção do conceito Produtor/Consumidor (Prosumer) Promoção da eficiência energética Reorganização da fiscalidade e dos sistemas de incentivos do sistema energético (Fiscalidade Verde) Aprovisionamento público “energeticamente eficiente e ambientalmente relevante” Comunicação, sensibilização, monitorização e reporte da avaliação das políticas no sector da energia.
. Promoção do conceito Produtor/Consumidor (Prosumer) Promoção da eficiência energética Reorganização da fiscalidade e dos sistemas de incentivos do sistema energético (Fiscalidade Verde) Aprovisionamento público energeticamente eficiente e ambientalmente relevante Comunicação, sensibilização, monitorização e reporte da avaliação das políticas no sector da energia..")
Apresentações semelhantes


 Bilbao, 1 Mar 2012 Fernando Ribeiro e Castro Secretário-geral Comité económico y social.>")
 Combustíveis Fósseis (1, 2, 3)>")


