Carregar apresentação
A apresentação está carregando. Por favor, espere

1
E as questôes? CIE cores Carbono artigo? Eficiência de emissores de luz

2
Interpretação do diagrama de cromaticidade CIE
Color name Red Green Blue 191 27 75 Pink 245 220 208 Reddish orange 216 119 51 Orange pink 240 204 162 Orange 228 184 29 Yellowish orange 231 224 Yellow 234 94 Greenish yellow 235 233 Yellow green 185 214 4 Yellowish green 170 209 60 163 71 Bluish green 24 121 Bluegreen 95 164 190 Greenish blue 110 175 199 92 138 202 Purplish blue 88 Bluish purple 102 177 Purple 246 85 158 Reddish purple 196 64 143 Purplish pink 243 219 Red purple 35 132 Purplish red 65 136 White 255 Hyperphysics Georgia State University The CIE system characterizes colors by a luminance parameter Y and two color coordinates x and y which specify the point on the chromaticity diagram. This system offers more precision in color measurement than do the Munsell and Ostwald systems because the parameters are based on the spectral power distribution (SPD) of the light emitted from a colored object and are factored by sensitivity curves which have been measured for the human eye. Based on the fact that the human eye has three different types of color sensitive cones, the response of the eye is best described in terms of three "tristimulus values". However, once this is accomplished, it is found that any color can be expressed in terms of the two color coordinates x and y. The colors which can be matched by combining a given set of three primary colors (such as the blue, green,a nd red of a color television screen) are represented on the chromaticity diagram by a triangle joining the coordinates for the three colors. Diagrama que caracteriza as cores por um parâmetro Y de Luminância e duas coordenadas de cores x e y que especifica o ponto no diagrama de cromaticidade.
 of the light emitted from a colored object and are factored by sensitivity curves which have been measured for the human eye. Based on the fact that the human eye has three different types of color sensitive cones, the response of the eye is best described in terms of three tristimulus values . However, once this is accomplished, it is found that any color can be expressed in terms of the two color coordinates x and y. The colors which can be matched by combining a given set of three primary colors (such as the blue, green,a nd red of a color television screen) are represented on the chromaticity diagram by a triangle joining the coordinates for the three colors. Diagrama que caracteriza as cores por um parâmetro Y de Luminância e duas coordenadas de cores x e y que especifica o ponto no diagrama de cromaticidade.")
3
Bandas de energia de níveis permitidos no diamante
1s22s22p2 Fig.2.1 Splitting of individual energy levels to energy bands as atoms are brought closer together. Imaginary formation of a diamond crystal from isolated carbon atoms. Each atom has two 1s states, two 2s states, six 2p states, and higher states. For N atoms, the numbers of states are 2N, 2N, and 6N of type 1s, 2s, and 2p respectively. With a reduction in the interatomic spacing, these energy levels split into bands, and the 2s and 2p bands merge into a single band having 8N available states. As the interatomic spacing approaches the equilibrium spacing of diamond crystal, this band splits into two bands separated by an energy gap , where no allowed energy states for electrons exist forbidden gap. The upper band (called the conduction band) and the lower band (called the valence band) contain 4N states each. The lower 1s band is filled with 2N electrons, however, the 4N electrons residing in the original n = 2 state will now occupy states either in the valence band or in the conduction band. At 0 K, the electrons will occupy the lowest energy states available to them thus, the 4N states in the valence band will be completely filled, and the 4N states in the conduction band will be completely empty. ============ Figure :Energy bands for diamond versus lattice constant. Isolated carbon atoms contain six electrons, which occupy the 1s, 2s and 2p orbital in pairs. The energy of an electron occupying the 2s and 2p orbital is indicated on the figure. The energy of the 1s orbital is not shown. As the lattice constant is reduced, there is an overlap of the electron wavefunctions occupying adjacent atoms. This leads to a splitting of the energy levels consistent with the Pauli exclusion principle. The splitting results in an energy band containing 2N states in the 2s band and 6N states in the 2p band, where N is the number of atoms in the crystal. A further reduction of the lattice constant causes the 2s and 2p energy bands to merge and split again into two bands containing 4N states each. At zero Kelvin, the lower band is completely filled with electrons and labeled as the valence band. The upper band is empty and labeled as the conduction band.
 and the lower band (called the valence band) contain 4N states each. The lower 1s band is filled with 2N electrons, however, the 4N electrons residing in the original n = 2 state will now occupy states either in the valence band or in the conduction band. At 0 K, the electrons will occupy the lowest energy states available to them thus, the 4N states in the valence band will be completely filled, and the 4N states in the conduction band will be completely empty. ============ Figure :Energy bands for diamond versus lattice constant. Isolated carbon atoms contain six electrons, which occupy the 1s, 2s and 2p orbital in pairs. The energy of an electron occupying the 2s and 2p orbital is indicated on the figure. The energy of the 1s orbital is not shown. As the lattice constant is reduced, there is an overlap of the electron wavefunctions occupying adjacent atoms. This leads to a splitting of the energy levels consistent with the Pauli exclusion principle. The splitting results in an energy band containing 2N states in the 2s band and 6N states in the 2p band, where N is the number of atoms in the crystal. A further reduction of the lattice constant causes the 2s and 2p energy bands to merge and split again into two bands containing 4N states each. At zero Kelvin, the lower band is completely filled with electrons and labeled as the valence band. The upper band is empty and labeled as the conduction band.")
4
Artigo + Eficiencia APRIL 30, The cool white XLamp XP-G provides 139 lumens and 132 lumens per Watt at 350 mA.

5
LED

6
Eficiência APRIL 30, The cool white XLamp XP-G provides 139 lumens and 132 lumens per Watt at 350 mA. ======================= Published March The DOE projects that common LEDs will reach efficacy ratings approaching 150 LPW by the year As of this writing, efficacy ratings for SSL-LEDs have now surpassed Energy Star rated fluorescents and General Electric has announced a prototype LED with an efficacy exceeding 160 LPW. February 3, Cree reported efficacy record of 208 lumens per watt for a white power LED For light emitting diodes (and of, course, for Laser diodes even more so), efficiency is of supreme importance. How much light can you get for 1 W of electrical power that goes in the device Much progress has been made, and more will have to be made for light bulb replacement. The figure below illustrates that The record holder, the inverted pyramid LED, is described in some detail in the link. The Most Efficient LEDs and where to get them!
, efficiency is of supreme importance. How much light can you get for 1 W of electrical power that goes in the device Much progress has been made, and more will have to be made for light bulb replacement. The figure below illustrates that The record holder, the inverted pyramid LED, is described in some detail in the link. The Most Efficient LEDs and where to get them!")
7
Sabiam que... A partir de 1/1/2012 serão proibidas a fabricação de lâmpadas de tungstênio de 100W? A partir de 1/1/2013 serão proibidas a fabricação de lâmpadas de tungstênio de 75W? Lighting changes coming in 2012 with government ban Feb 18, 2011 Law will ban manufacture and use of incandescent bulbs Get ready for some mandated changes in lighting. Effective January 1, 2012, it will be a federal offense for any company or organization or individual in the U.S. to manufacture or import 100-watt incandescent light bulbs for general-use lighting. California has already banned the 100-watt incandescents starting the beginning of this year. The reason for the ban is because there are other lighting alternatives today that consume considerably less electricity than the incandescent bulbs. You can continue using your 100-watt bulbs incandescent bulbs next year and you can replace those bulbs with other 100-watt incandescents that you may have in inventory. But you will be unable to purchase the bulbs after January 1, In fact, you may not be able to find them in stores during the last few months of Other sizes of incandescent bulbs for general use will also be banned at later dates. Effective January 1, 2013, 75-watt incandescent bulbs will face a similar ban; the 60-watt and 40-watt incandescents will be banned effective January 1, Specialty incandescent bulbs will not be facing these bans. Specialty bulbs include 3-way bulbs, appliance lights, “bug lights”, colored bulbs, vibration-service and rough-service bulbs, and bulbs used for marine and mining applications. What are your lighting alternatives? When searching for an alternative for incandescent bulbs, look for lighting efficiency, expressed as lumens per watt. As shown in the figure below, the wattage rating of a bulb merely indicates the wattage of electricity required for input to the bulb. The light output is measured in lumens. Thus the lighting efficiency is lumens per watt. See the table below for the efficiency ratings of some of the more common lights used today. Note that the compact fluorescent light (CFL) is about four times more efficient than the incandescent. In addition, the CFL has a life span of about 10,000 hours versus 1,000 hours for a typical incandescent. A disadvantage of the CFL is that the bulb contains both mercury and lead – potentially hazardous heavy metals. Although these bulbs contain significantly less mercury and lead than they did a decade ago, the bulbs still must be handled in a responsible manner for disposal. Most “big box” home improvement stores now have drop-off sites for proper disposal of the burned-out CFL bulbs. The LED (light emitting diodes) bulbs are even more efficient than the CFL and the life of an LED is longer than the cfl. LEDs are both mercury and lead free. I do not recommend LEDs today simply because they are still too expensive, although the prices have become lower in recent years. I anticipate significant reductions in the price of LEDs within the next five years or so and then they may be feasible lighting alternatives. Dennis Buffington, Department of Agricultural and Biological Engineering
 is about four times more efficient than the incandescent. In addition, the CFL has a life span of about 10,000 hours versus 1,000 hours for a typical incandescent. A disadvantage of the CFL is that the bulb contains both mercury and lead – potentially hazardous heavy metals. Although these bulbs contain significantly less mercury and lead than they did a decade ago, the bulbs still must be handled in a responsible manner for disposal. Most big box home improvement stores now have drop-off sites for proper disposal of the burned-out CFL bulbs. The LED (light emitting diodes) bulbs are even more efficient than the CFL and the life of an LED is longer than the cfl. LEDs are both mercury and lead free. I do not recommend LEDs today simply because they are still too expensive, although the prices have become lower in recent years. I anticipate significant reductions in the price of LEDs within the next five years or so and then they may be feasible lighting alternatives. Dennis Buffington, Department of Agricultural and Biological Engineering.")
8
E o futuro?

9
Aula anterior OLED Diodo laser, cavidade horizontal, cavidade vertical, homo-heterojunção. Outras fontes de luz: relâmpago? Arco, sincrotron, fonte radioativa

10
Dispositivos detectores ópticos
Aula de hoje Dispositivos detectores ópticos

11
Sistema de comunicações ópticas

12
Diagrama funcional de um receptor
Buffer = amortecedor? Tampão?

13
Dispositivos detectores de luz
Geral Figuras de mérito num detector Fotomultiplicadora PMT Fotodiodos: PIN, APD Outros P-type Intrinsic N-type (PIN) Avalanche Photodiode (APD)
 Avalanche Photodiode (APD)")
14
Algumas considerações
Historicamente: tubo a gás, tubo a vácuo, térmico e vários dispositivos semicondutores Vantagens – desvantagens Que parâmetros são recomendáveis para observar na escolha de um detector: Faixa espectral Intensidade Tempo de resposta Condições ambientais Custo

15
Curva de atenuação espectral
Espalhamento Rayleigh = com partículas muito pequenas, menor que o lamda Espalhamento MIE = lamda maior que o tamanho das partículas

16
Tipos de detectores Fotônicos Térmicos Fotoemissão
Fotocondutividade Fotovoltaico Filme fotográfico Térmicos Abs de fótons gera DT (bolômetro) Termopilha Piroelétrico Geralmente lentos, com exceção do piroelétrico Resposta uniforme em toda a faixa espectral A bolometer is a device for measuring incident electromagnetic radiation. It was invented in 1878 by the American astronomer Samuel Pierpont Langley. It consists of an "absorber" connected to a heat sink (area of constant temperature) through an insulating link. The result is that any radiation absorbed by the absorber raises its temperature above that of the heat sink—the higher the power absorbed, the higher the temperature will be. A thermometer of some kind, attached to the absorber, is used to measure the temperature, from which the absorbed power can be calculated. In some designs the thermometer is also the absorber; in others the absorber and thermometer are separate; this is known as "composite design". While bolometers can be used to measure radiation of any frequency, for most wavelength ranges there are other methods of detection that are more sensitive. However, for sub-millimetre wavelengths (from around 200 µm to 1 mm wavelength), the bolometer is the most sensitive type of detector for any measurement over more than a very narrow wavelength range. Bolometers are therefore used for astronomy at these wavelengths. However, to achieve the best sensitivity, they must be cooled down to a fraction of a degree above absolute zero (typically from 50 millikelvins to 300 mK); this makes their operation technically somewhat challenging. The term bolometer is also used in high-energy physics (particle physics) to designate an unconventional particle detector. They use the same principle described above. The bolometers are sensitive not only to light but to every form of energy.
 Termopilha. Piroelétrico. Geralmente lentos, com exceção do piroelétrico. Resposta uniforme em toda a faixa espectral. A bolometer is a device for measuring incident electromagnetic radiation. It was invented in 1878 by the American astronomer Samuel Pierpont Langley. It consists of an absorber connected to a heat sink (area of constant temperature) through an insulating link. The result is that any radiation absorbed by the absorber raises its temperature above that of the heat sink—the higher the power absorbed, the higher the temperature will be. A thermometer of some kind, attached to the absorber, is used to measure the temperature, from which the absorbed power can be calculated. In some designs the thermometer is also the absorber; in others the absorber and thermometer are separate; this is known as composite design . While bolometers can be used to measure radiation of any frequency, for most wavelength ranges there are other methods of detection that are more sensitive. However, for sub-millimetre wavelengths (from around 200 µm to 1 mm wavelength), the bolometer is the most sensitive type of detector for any measurement over more than a very narrow wavelength range. Bolometers are therefore used for astronomy at these wavelengths. However, to achieve the best sensitivity, they must be cooled down to a fraction of a degree above absolute zero (typically from 50 millikelvins to 300 mK); this makes their operation technically somewhat challenging. The term bolometer is also used in high-energy physics (particle physics) to designate an unconventional particle detector. They use the same principle described above. The bolometers are sensitive not only to light but to every form of energy.")
17
Definições e Figuras de mérito
R = Responsividade t = Constante de tempo NEP = Noise Equivalent Power D* = Detectividade Qual é o mínimo de luz que o detector permite acusar o ruído? Que sinal será obtido por unidade de irradiança? Como o sinal do detector muda com l? Qual é a freqüência de modulação que o detector pode responder? Noise-equivalent power Noise-equivalent power (NEP) is the radiant power that produces a signal-to-noise ratio of unity at the output of a given optical detector at a given data-signaling rate or modulation frequency, operating wavelength, and effective noise bandwidth. Note 1: Some manufacturers and authors define NEP as the minimum detectable power per square root bandwidth. When defined this way, NEP has the units of watts per (hertz)1/2. Therefore, the term is a misnomer, because the units of power are watts. Note 2: Some manufacturers define NEP as the radiant power that produces a signal-to-dark-current noise ratio of unity. The NEP measurement is valid only if the dark-current noise dominates the noise level. This article contains material from the Federal Standard 1037C (in support of MIL-STD-188), which, as a work of the United States Government, is in the public domain
 is the radiant power that produces a signal-to-noise ratio of unity at the output of a given optical detector at a given data-signaling rate or modulation frequency, operating wavelength, and effective noise bandwidth. Note 1: Some manufacturers and authors define NEP as the minimum detectable power per square root bandwidth. When defined this way, NEP has the units of watts per (hertz)1/2. Therefore, the term is a misnomer, because the units of power are watts. Note 2: Some manufacturers define NEP as the radiant power that produces a signal-to-dark-current noise ratio of unity. The NEP measurement is valid only if the dark-current noise dominates the noise level. This article contains material from the Federal Standard 1037C (in support of MIL-STD-188), which, as a work of the United States Government, is in the public domain.")
18
Definições - Responsividade R
Responsividade R : A principal função de um detector de radiação é converter a radiação eletromagnética em corrente ou tensão elétrica. O termo responsividade é usado para descrever a amplitude do sinal elétrico gerado com respeito ao fluxo incidente. A responsividade pode ser determinada por: onde: Vsaída é a tensão de saída do detector [V]; Φincidente é o fluxo da radiação eletromagnética incidente [Watts]; E(λ,f) é a irradiância [W/cm2]; Ad é a área do detector [cm2]; Ao invés de voltagem de saída pode ser também corrente de saída [A/W]
 é a irradiância [W/cm2]; Ad é a área do detector [cm2]; Ao invés de voltagem de saída pode ser também corrente de saída [A/W]")
19
Definições – Constante de tempo tc
Constante de Tempo tc: Se a saída de um detector muda exponencialmente com o tempo, o tempo requerido para que mude desde seu valor inicial por uma fração [1-exp(-t/tc)] para t=tc do valor final é denominado constante de tempo
] para t=tc do valor final é denominado constante de tempo.")
20
Definições – NEP (Noise Equivalent Power)
NEP (potência equivalente de ruído). A sensibilidade de um detector pode ser especificada pelo seu NEP, um parâmetro definido como a potencia radiante incidente sobre o detector que produz um sinal igual à raiz quadrática media (rms) do ruído do detector. Podemos considerar a relação com a responsividade: NEP = VN/RP NEP = IN/RI Onde VN e IN são voltagem e corrente do ruído, das respectivas responsividades R do detector. Como a responsividade depende do comprimento de onda também o NEP depende.
. A sensibilidade de um detector pode ser especificada pelo seu NEP, um parâmetro definido como a potencia radiante incidente sobre o detector que produz um sinal igual à raiz quadrática media (rms) do ruído do detector. Podemos considerar a relação com a responsividade: NEP = VN/RP. NEP = IN/RI. Onde VN e IN são voltagem e corrente do ruído, das respectivas responsividades R do detector. Como a responsividade depende do comprimento de onda também o NEP depende.")
21
NEP = Noise Equivalent Power
NEP = valor rms da potência modulada senoidalmente que incide sobre o detector o qual oferece uma voltagem do sinal rms igual à voltagem de ruído rms do detector. Especificada normalmente em termos de uma fonte de Rad. de Corpo 500K Largura de banda de referência para detecção do sinal e ruído de 1 ou 5 Hz Freq. de mod. da rad.: geralmente 90, 400, 800 ou 900 Hz. e.g. NEP(500K,900,1), significa uma fonte de rad corpo 500K, freq. de modulação de 900 Hz, e largura de banda de detecção de 1 Hz Unidades de NEP [W Hz-1/2] I = intensidade radiante que incide no detector [W m-2] A = área sensitiva do detector [m2] Vs = voltagem do sinal medida com Df [Hz] Vn = voltagem do ruído medido com Df [Hz] Então: Noise Equivalent Power (NEP) In many design applications, the designer needs to know the minimum detectable light (power) of the photodiode. The minimum incident power required on a photdiode to generate a photocurrent equal to the total photodiode noise current is defined as the noise equivalent power, or NEP. noise equivalent power (NEP): At a given data-signaling rate or modulation frequency, operating wavelength, and effective noise bandwidth, the radiant power that produces a signal-to-noise ratio of unity at the output of a given optical detector. Note 1: Some manufacturers and authors define NEP as the minimum detectable power per square root bandwidth. When defined this way, NEP has the units of watts per (hertz)1/2. Therefore, the term is a misnomer, because the units of power are watts. Note 2: Some manufacturers define NEP as the radiant power that produces a signal-to-dark-current noise ratio of unity. The NEP measurement is valid only if the dark-current noise dominates the noise level.
, significa uma fonte de rad corpo 500K, freq. de modulação de 900 Hz, e largura de banda de detecção de 1 Hz. Unidades de NEP [W Hz-1/2] I = intensidade radiante que incide no detector [W m-2] A = área sensitiva do detector [m2] Vs = voltagem do sinal medida com Df [Hz] Vn = voltagem do ruído medido com Df [Hz] Então: Noise Equivalent Power (NEP) In many design applications, the designer needs to know the minimum detectable light (power) of the photodiode. The minimum incident power required on a photdiode to generate a photocurrent equal to the total photodiode noise current is defined as the noise equivalent power, or NEP. noise equivalent power (NEP): At a given data-signaling rate or modulation frequency, operating wavelength, and effective noise bandwidth, the radiant power that produces a signal-to-noise ratio of unity at the output of a given optical detector. Note 1: Some manufacturers and authors define NEP as the minimum detectable power per square root bandwidth. When defined this way, NEP has the units of watts per (hertz)1/2. Therefore, the term is a misnomer, because the units of power are watts. Note 2: Some manufacturers define NEP as the radiant power that produces a signal-to-dark-current noise ratio of unity. The NEP measurement is valid only if the dark-current noise dominates the noise level.")
22
Alguns valores NEP From Wikipedia, the free encyclopedia Jump to: navigation, search Noise-equivalent power (NEP) is the radiant power that produces a signal-to-noise ratio of unity at the output of a given optical detector at a given data-signaling rate or modulation frequency, operating wavelength, and effective noise bandwidth. Note 1: Some manufacturers and authors define NEP as the minimum detectable power per square root bandwidth. When defined this way, NEP has the units of watts per (hertz)1/2. Therefore, the term is a misnomer, because the units of power are watts. Note 2: Some manufacturers define NEP as the radiant power that produces a signal-to-dark-current noise ratio of unity. The NEP measurement is valid only if the dark-current noise dominates the noise level. This article contains material from the Federal Standard 1037C (in support of MIL-STD-188), which, as a work of the United States Government, is in the public domain.
 is the radiant power that produces a signal-to-noise ratio of unity at the output of a given optical detector at a given data-signaling rate or modulation frequency, operating wavelength, and effective noise bandwidth. Note 1: Some manufacturers and authors define NEP as the minimum detectable power per square root bandwidth. When defined this way, NEP has the units of watts per (hertz)1/2. Therefore, the term is a misnomer, because the units of power are watts. Note 2: Some manufacturers define NEP as the radiant power that produces a signal-to-dark-current noise ratio of unity. The NEP measurement is valid only if the dark-current noise dominates the noise level. This article contains material from the Federal Standard 1037C (in support of MIL-STD-188), which, as a work of the United States Government, is in the public domain.")
23
D* = Detectivity D* antigamente definido como 1/NEP
Porém muitos detectores atuais exibem um NEP proporcional à raiz quadrada da área do detector Especificações tb condicionadas na NEP e.g. D*(500 K,900,1) Para especificar a dependência do detector com l, é usada a notação D*(l,900,1) Unidades de D* [Hz1/2 W-1] Ver slide anteriores em NEP para definições de D* Fonte de radiação de corpo negro de 500K, modulado a 900Hz, com largura de banda de detecção de 1Hz
 Para especificar a dependência do detector com l, é usada a notação D*(l,900,1) Unidades de D* [Hz1/2 W-1] Ver slide anteriores em NEP para definições de D* Fonte de radiação de corpo negro de 500K, modulado a 900Hz, com largura de banda de detecção de 1Hz.")
24
Alguns valores de D* BLIP = Background Limited Performance
The ultimate in detector performance is achieved when the noise generated by the system background flux is larger than any thermally generated noise within the detector. The detector is then said to exhibit background limited performance (BLIP). For an incident background flux, fB photons/cm2/s, the photon generated density of carriers is nf = hafBt/t, where ha is the absorption quantum efficiency, t is the lifetime of the relevant carrier, and t is the detector thickness. Thus, BLIP is achieved when hafBt/t > nth. Rearranging, we have for the BLIP requirement
. For an incident background flux, fB photons/cm2/s, the photon generated density of carriers is nf = hafBt/t, where ha is the absorption quantum efficiency, t is the lifetime of the relevant carrier, and t is the detector thickness. Thus, BLIP is achieved when hafBt/t > nth. Rearranging, we have for the BLIP requirement.")
25
R = Resposta (responsividade)
A resposta R de um detector especifica sua resposta à unidade de irradiança Onde Vs = voltagem sinal I = densidade de potência A = área do detector Outra notação para a responsividade R em termos da corrente de saída do detector e utilizada para caracterizar detectores fotoemissivos é a sensitividade radiante S, que é a corrente por unidade de área da superfície fotoemissiva produzida por uma unidade de irradiança Is é a corrente total do detector e P é a potência radiante incidente. Medindo-se a tensão de sinal, VS, produzida pela densidade de potência H e a tensão de ruído, VN, bloqueando-se a radiação incidente no dispositivo, pode-se calcular a detetividade dada pela relação 6.Tabela III - Fator rms do modulador mecânico.C = qa/qtF (fator rms)0 (onda quadrada)0,4500,050,4480,080,4450,100,4420,150,4330,200,4210,250,4050,300,3860,400,3400,50 (onda triangular)0,286 [6] Na relação acima, fo é a frequência de modulação da radiação incidente, Df a banda passante do amplificador e A a área sensível do detector. Nesta figura de mérito é importante controlar e explicitar sempre os parâmetros TBB, fo e Df, ou seja, o resultado final só tem significado se acompanhado dos valores TBB, fo e Df, que representam as condições de medida. TBB define a distribuição espectral da radiação de corpo negro enquanto fo e Df afetam o nível de ruido presente no detector. What is spectral responsivity? The spectral responsivity of an optical detector is a measure of its response to radiation at a specified wavelength. The precise definition depends on the way that the detector is used: When the whole optical beam falls within the detector aperture the responsivity is equal to the ratio of detector response to beam radiant power. When the detector is placed in a radiation field which over-fills its active area (the aperture) the responsivity is equal to the ratio of detector response to the irradiance of the field. How is it measured? Since spectral responsivity is defined at a specific wavelength monochromatic (i.e. single wavelength) optical radiation must be used to make the measurement. Traditionally, such radiation has been generated by means of a prism or diffraction grating monochromator, which selects a narrow wavelength band from a broad band lamp source such as a tungsten lamp. Such techniques are used at NPL for generation of radiation between 200 nm and 20,000 nm. The wavelength can readily be tuned continuously allowing measurement of spectral responsivity across the wavelength range for which the detector is used. The limitations of this method are relatively low power levels and low wavelength resolution, both of which restrict the accuracy of calibration. Alternatively, lasers can be used as calibration sources. These have much narrower spectral bandwidth and generally much higher output power, making them the source of choice for high accuracy work. NPL has a suite of lasers for this purpose covering much of the wavelength range between 210 and 1700 nm, as well as important spectral regions at longer wavelengths up to 11,000 nm (see NLRF web page). In all cases the detector under test is compared with a standard detector of known spectral responsivity traceable to the NPL primary cryogenic radiometer (see cryogenic radiometer web page). Such detectors include silicon and InGaAs photodiodes. and pyroelectric detectors. Detector Characterisation No detector has a constant spectral responsivity under all conditions of use. For instance, the responsivity of photodiode detectors falls off above a certain incident power level due to saturation effects. Full evaluation of a detector requires characterisation of such effects. This information allows the identification of the detector with the best performance for a particular application. Also, a detector to be used for calibration purposes should be fully characterised in order to evaluate the uncertainty of such calibrations. NPL has assembled dedicated facilities which permit the characterisation/measurement of the following detector parameters: Linearity range: This is the range of incident radiant power levels over which the detector output varies linearly with incident power. Incident power levels in the range – 10-2 W can be generated at different wavelengths using either lamp-based or laser-based methods. In this way the saturation threshold of a detector can be determined Spatial non-uniformity of response: the variation of responsivity across the active area of a detector is determined by scanning a small patch of radiation at a selected wavelength over the surface. Noise Equivalent Power (NEP): the incident radiant power at a specific wavelength and modulation frequency necessary to produce a signal-to-noise ratio of 1 at the detector output. Temperature coefficient of response: the variation of responsivity with temperature Detector shunt resistance: the slope of the current-voltage curve of a photovoltaic detector at zero-volt bias.
0 (onda quadrada)0,4500,050,4480,080,4450,100,4420,150,4330,200,4210,250,4050,300,3860,400,3400,50 (onda triangular)0,286 [6] Na relação acima, fo é a frequência de modulação da radiação incidente, Df a banda passante do amplificador e A a área sensível do detector. Nesta figura de mérito é importante controlar e explicitar sempre os parâmetros TBB, fo e Df, ou seja, o resultado final só tem significado se acompanhado dos valores TBB, fo e Df, que representam as condições de medida. TBB define a distribuição espectral da radiação de corpo negro enquanto fo e Df afetam o nível de ruido presente no detector. What is spectral responsivity The spectral responsivity of an optical detector is a measure of its response to radiation at a specified wavelength. The precise definition depends on the way that the detector is used: When the whole optical beam falls within the detector aperture the responsivity is equal to the ratio of detector response to beam radiant power. When the detector is placed in a radiation field which over-fills its active area (the aperture) the responsivity is equal to the ratio of detector response to the irradiance of the field. How is it measured Since spectral responsivity is defined at a specific wavelength monochromatic (i.e. single wavelength) optical radiation must be used to make the measurement. Traditionally, such radiation has been generated by means of a prism or diffraction grating monochromator, which selects a narrow wavelength band from a broad band lamp source such as a tungsten lamp. Such techniques are used at NPL for generation of radiation between 200 nm and 20,000 nm. The wavelength can readily be tuned continuously allowing measurement of spectral responsivity across the wavelength range for which the detector is used. The limitations of this method are relatively low power levels and low wavelength resolution, both of which restrict the accuracy of calibration. Alternatively, lasers can be used as calibration sources. These have much narrower spectral bandwidth and generally much higher output power, making them the source of choice for high accuracy work. NPL has a suite of lasers for this purpose covering much of the wavelength range between 210 and 1700 nm, as well as important spectral regions at longer wavelengths up to 11,000 nm (see NLRF web page). In all cases the detector under test is compared with a standard detector of known spectral responsivity traceable to the NPL primary cryogenic radiometer (see cryogenic radiometer web page). Such detectors include silicon and InGaAs photodiodes. and pyroelectric detectors. Detector Characterisation. No detector has a constant spectral responsivity under all conditions of use. For instance, the responsivity of photodiode detectors falls off above a certain incident power level due to saturation effects. Full evaluation of a detector requires characterisation of such effects. This information allows the identification of the detector with the best performance for a particular application. Also, a detector to be used for calibration purposes should be fully characterised in order to evaluate the uncertainty of such calibrations. NPL has assembled dedicated facilities which permit the characterisation/measurement of the following detector parameters: Linearity range: This is the range of incident radiant power levels over which the detector output varies linearly with incident power. Incident power levels in the range – 10-2 W can be generated at different wavelengths using either lamp-based or laser-based methods. In this way the saturation threshold of a detector can be determined. Spatial non-uniformity of response: the variation of responsivity across the active area of a detector is determined by scanning a small patch of radiation at a selected wavelength over the surface. Noise Equivalent Power (NEP): the incident radiant power at a specific wavelength and modulation frequency necessary to produce a signal-to-noise ratio of 1 at the detector output. Temperature coefficient of response: the variation of responsivity with temperature. Detector shunt resistance: the slope of the current-voltage curve of a photovoltaic detector at zero-volt bias.")
26
Alguns valores de D* e R - InGaAs
Para diferentes cutoff

27
InGaAs em diferentes “cutoff”
Judson – InGaAs e Ge InGaAs em diferentes “cutoff” Ge

28
Algumas curvas de resposta espectral e sensibilidade radiante

29
Resposta de freqüência e constante de tempo
A resposta de freqüência de um detector é definida pela variação da resposta R ou sensibilidade radiante em função da freqüência de modulação da radiação incidente. A variação em freqüência da resposta R e a constante de tempo t estão geralmente relacionadas a través da equação: Curva típica da dependência da resposta com a freqüência de um detector

30
Ruído A flutuação randômica na voltagem de saída ou corrente de um detector estabelece um limite inferior à potencia radiante que pode ser detectada, dentro das condições de operacionabilidade (temperatura, freqüência de modulação e largura de banda)
")
31
Fontes de ruído no detector (receptor)
Ruído de fótons Tb denominado “shot noise” ou ruído quântico, estatística de Poisson. Ruído de fotoeletrons Processo de fotodetecção randômico Ruído de ganho eg. Processos de ganho em APD’s e EDFA’s gera ruído. Ruído no circuito receptor Resistores e transistores no amplificador contribuem ao ruído do circuito. PD sem ganho PD com ganho (APD) Compact Erbium Doped Fiber Amplifier (EDFA) The compact low-cost EDFA is a small form factor module with a cooler-less pump laser that offers economical amplification for a wide range of applications. It is designed to amplify from one to eight channels with 100 GHz or 50 GHz ITU-T grid in the C-band. This module is ideal for today’s highly dynamic networks and cost sensitive market. A standard 6-pin electrical connector (HIROSE DF11-6DP-2DSA) allows for easy electrical connectivity. A standard RS232 or I^2C electrical interface is provided for full functional EDFA. Like all Lightwaves2020's products, the EDFA is Telcordia compliant. Erbium-Doped Optical Fiber Amplifier (EDFA) Erbium-Doped Optical Fiber Amplifier (EDFA) is a new device that has been applied in optical fiber transmission systems in 90's of twentieth century. Its wide application has brought out a revolution in the field of optical fiber communication. Compared with other types of optical amplifiers, EDFA has unique features of high out out power and gain, wide operating bandwidth, low polarization dependence, low noise figure independence of bit rate and data format.
 Compact Erbium Doped Fiber Amplifier (EDFA) The compact low-cost EDFA is a small form factor module with a cooler-less pump laser that offers economical amplification for a wide range of applications. It is designed to amplify from one to eight channels with 100 GHz or 50 GHz ITU-T grid in the C-band. This module is ideal for today’s highly dynamic networks and cost sensitive market. A standard 6-pin electrical connector (HIROSE DF11-6DP-2DSA) allows for easy electrical connectivity. A standard RS232 or I^2C electrical interface is provided for full functional EDFA. Like all Lightwaves2020 s products, the EDFA is Telcordia compliant. Erbium-Doped Optical Fiber Amplifier. (EDFA) Erbium-Doped Optical Fiber Amplifier (EDFA) is a new device that has been applied in optical fiber transmission systems in 90 s of twentieth century. Its wide application has brought out a revolution in the field of optical fiber communication. Compared with other types of optical amplifiers, EDFA has unique features of high out out power and gain, wide operating bandwidth, low polarization dependence, low noise figure independence of bit rate and data format.")
32
Ruído Ruído Johnson (Gaussiano e branco)
Frequency Noise Power Shot noise (Gaussiano e branco) Frequency Noise Power Ruído “1/f” Frequency Noise Power 1/f noise Fc
 Frequency. Noise Power. Ruído 1/f Frequency. Noise Power. 1/f noise. Fc.")
33
Eficiência quântica Correspondência direta entre # de fótons absorvidos e # de portadores de carga gerados que são subseqüentemente usados no circuito elétrico

34
Detectores fotoemissivos
Baseados no efeito fotoelétrico e geração de portadores de carga. Fotodiodos à vácuo e à gás, PMT e Photo-channeltron

35
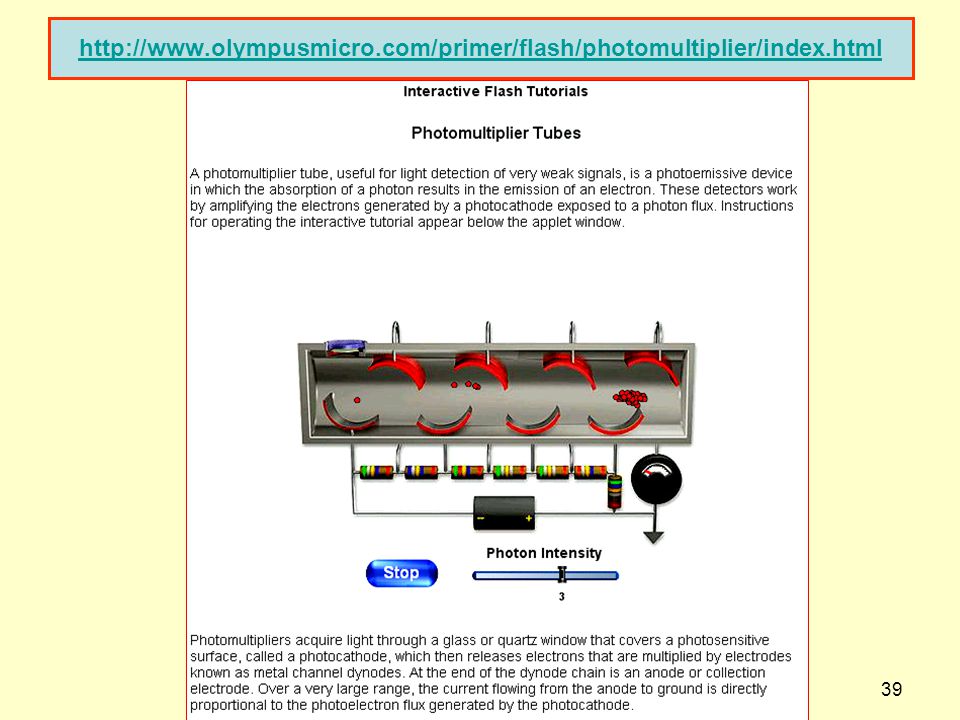
Fotomultiplicadora - PMT
Impacto inicial sobre material fotoemissivo Posterior emissão secundaria de elétrons a través de dinodos Multiplicação considerável de elétrons Ganho de 109 elétrons no anodo por fotoelétron (pulso) Ganho de 107 em modo continuo E.g. pulso de 2ns no anodo com 109 fotoelétrons gera 4V numa RL de 50 Contador de fótons D* até 1016 cm Hz1/2 W-1, só o olho humano é capaz de detectar 10 fótons no azul que se aproxima a esse valor.
 Ganho de 107 em modo continuo. E.g. pulso de 2ns no anodo com 109 fotoelétrons gera 4V numa RL de 50 Contador de fótons. D* até 1016 cm Hz1/2 W-1, só o olho humano é capaz de detectar 10 fótons no azul que se aproxima a esse valor.")
36
Características essenciais na montagem de PMT

37
Corte transversal de uma PMT

38
Algumas características dos dinodos
Muitos materiais emitem, em média, d novos elétrons por cada elétron que colide na sua superfície. Se a energia cinética do elétron incidente for suficientemente energética, entre 100 e 200 eV, então d > 1, teremos amplificação Assim teremos para N dinodos a geração de dN elétrons

40
Superfícies fotoemissivas de PMT’s

41
Multiplicador de elétrons ou channeltron
A channeltron is effectively a photomultiplier with an infinite number of dynodes. It consists of a hollow, evacuated tube (the 'channel'), generally curved, of a few mm section and a few cm long, made of semiconducting glass: its inner surface acts as both, the photocathode and a continuous dynode. Channeltrons are used to detect optical, UV, X-ray light, electrons and ions (e.g. they were used as X-ray detectors on the Copernicus satellite, and in early MSSL magnetospheric experiments). Basically, when light, or charged particles, strike the channeltron's inner surface close to the entrance, electrons are expelled from it. An electric field, established by applying a positive voltage of several kV between the ends of the tube, accelerates the secondary electrons emitted at each point, they hit the walls again and again generating more and more secondary electrons; finally, the cloud of electrons is collected at the anode. The channeltron is curved to prevent 'ion feedback': this takes place when residual gas molecules, still present even if the device is run in vacuum, are ionised, becoming positive ions, are accelerated opposite to the electrons, reach the front end and release electrons which may produce spurious signals.
, generally curved, of a few mm section and a few cm long, made of semiconducting glass: its inner surface acts as both, the photocathode and a continuous dynode. Channeltrons are used to detect optical, UV, X-ray light, electrons and ions (e.g. they were used as X-ray detectors on the Copernicus satellite, and in early MSSL magnetospheric experiments). Basically, when light, or charged particles, strike the channeltron s inner surface close to the entrance, electrons are expelled from it. An electric field, established by applying a positive voltage of several kV between the ends of the tube, accelerates the secondary electrons emitted at each point, they hit the walls again and again generating more and more secondary electrons; finally, the cloud of electrons is collected at the anode. The channeltron is curved to prevent ion feedback : this takes place when residual gas molecules, still present even if the device is run in vacuum, are ionised, becoming positive ions, are accelerated opposite to the electrons, reach the front end and release electrons which may produce spurious signals.")
42
Temas de apresentações (sugestão ~30’ a 40’) para o dia 25/04
Gabriel - CIE Gustavo - NEP, D*, BLIP Tarcisio - R Thiago ruído

43
Aula que vem: continuação sobre detectores

Apresentações semelhantes


 Ref: Digital Communications Bernard Sklar 1a edição>")


