Carregar apresentação
A apresentação está carregando. Por favor, espere

1
Farmaeconomia Aplicando conceito à prática
Dr. Stephen Stefani Coordenador da Câmara Técnica de Oncologia da UNIMED do Brasil Professor da Fundação UNIMED Presidente do Capítulo Brasil da International Society of Pharmacoeconomics and Outcome Research (ISPOR)
")
2
Declaração de potencial conflito de interesses
Não tenho conflitos de interesse ligados ao tema discutido nesta palestra Declaração de potencial conflito de interesses R1595/2000 Conselho Federal de Medicina (CFM) Resolução RDC 102/2000 (ANVISA )
 Resolução RDC 102/2000 (ANVISA )")
4
Dados de Referência

9
Relação entre atores

11
Análise Contratual Baseia-se em leis federais (LEI NO 9656, MP , CDC) e nos contratos vigentes Lei e diretrizes da empresa influenciadores Gestores Analistas Auditores respeito ao contrato administração/ excessos respeito à prescrição referenciais concorrência tabelas independentes controle das contas políticas de pagamento

12
Justiça Social 78% dos juízes entendem que a justiça social justifica decisões que violem os contratos 83,7% dos juízes com menos de 40 anos entendem que deve-se julgar contra a lei a favor da justiça social Briga com judiciário Fonte: IPEA

13
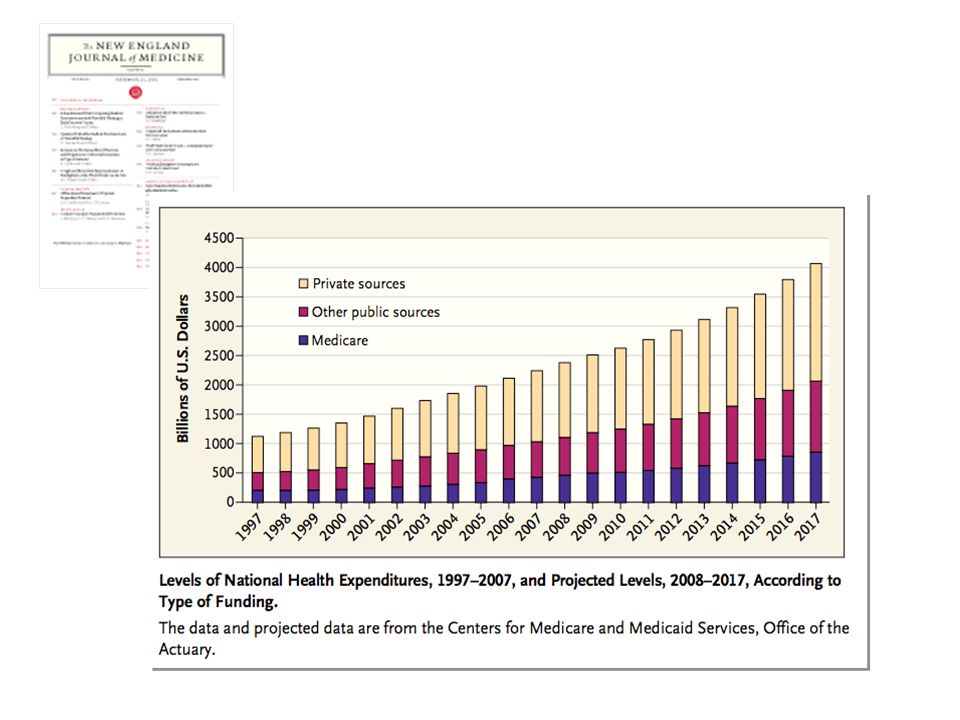
Aumento dos custos com demanda explodiu!

14
A sociedade produziu uma revolução na Medicina que aumentou a vida do homem, mas ela não foi capaz de criar uma revolução financeira que a sustentasse com dignidade J.F.Kennedy

15
Barreiras de um novo tratamento para acesso ao mercado
Análise Econômica Qualidade Segurança Eficácia

16
Agências para Avaliação de Tecnologia em Saúde
CCOHTA NICE ATS obrigatória ATS desejável ATS voluntária NGC PBAC

17
Decisão de Adoção de Tecnologia
IV + I Diferença de Custos A Estratégia A é menos efetiva e mais cara Estratégia A é mais efetivas mas é mais cara (Estratégia a ser rejeitada ) (Custo efetividade) + - Diferença de Efeito The idea behind using these different methods for PE analysis is to help make decisions between alternative therapies. Again, in PE evaluation, we are interested in both the costs and the outcomes, and both must be considered. No matter which methodology is used, the resulting information should aid in decision making. This decision grid can be used to think about how we might use data from a PE study to determine whether a new therapy should be adopted. You’ll see that the cost impact is along the side and the outcome is along the top. This first cell (ADOPT ) indicates that a new drug, for example, is less costly than the gold standard, and also has an improved outcome. This would be a straight-forward decision to adopt the new drug, because it is clearly better, in both costs and outcomes, of the standard therapy. Similarly this cell (DON”T ADOPT) shows that the new drug is more costly with worse outcomes than the standard. This, too, would be an easy decision not to adopt the new drug. It is when new drugs fall into the remaining two grids that decisions are less obvious. If the new drug is less costly but also has worse outcomes, it will be necessary to evaluate whether the improvement with the standard therapy is worth its additional cost. Similarly, if a new drug is more costly but improves outcomes, then you will need to determine whether the improvement is worth the additional cost. This situation really helps highlight the fact that PE analyses do not replace decision making, but rather, they provide additional information to aid in decision making. It will be up to the payer to determine whether added benefits are worth added costs. Estratégia A é mais efetiva e mais barata Estratégia A é menos efetiva e mais barata (cost–saving: Estratégia dominate) - III II
 (Custo efetividade) + - Diferença de Efeito. The idea behind using these different methods for PE analysis is to help make decisions between alternative therapies. Again, in PE evaluation, we are interested in both the costs and the outcomes, and both must be considered. No matter which methodology is used, the resulting information should aid in decision making. This decision grid can be used to think about how we might use data from a PE study to determine whether a new therapy should be adopted. You’ll see that the cost impact is along the side and the outcome is along the top. This first cell (ADOPT ) indicates that a new drug, for example, is less costly than the gold standard, and also has an improved outcome. This would be a straight-forward decision to adopt the new drug, because it is clearly better, in both costs and outcomes, of the standard therapy. Similarly this cell (DON T ADOPT) shows that the new drug is more costly with worse outcomes than the standard. This, too, would be an easy decision not to adopt the new drug. It is when new drugs fall into the remaining two grids that decisions are less obvious. If the new drug is less costly but also has worse outcomes, it will be necessary to evaluate whether the improvement with the standard therapy is worth its additional cost. Similarly, if a new drug is more costly but improves outcomes, then you will need to determine whether the improvement is worth the additional cost. This situation really helps highlight the fact that PE analyses do not replace decision making, but rather, they provide additional information to aid in decision making. It will be up to the payer to determine whether added benefits are worth added costs. Estratégia A é mais efetiva e mais barata. Estratégia A é menos efetiva e mais barata. (cost–saving: Estratégia dominate) - III. II.")
18
Drummond et al. Ann Int Med 1987; 107(1): 88–92
Farmacoeconomia Ciência que analisa as relações entre custos e desfechos de diferentes alternativas de decisão em saúde, com o objetivo de identificar aquela capaz de oferecer o melhor resultado por unidade monetária investida. Drummond et al. Ann Int Med 1987; 107(1): 88–92 Kobelt G. Health Economics: an introduction to economic evaluation. London: OHE, 2002
: 88–92. Kobelt G. Health Economics: an introduction to economic evaluation. London: OHE,")
19
Determinação do Tipo de Análise

20
Base científica consistente
O que é “razoável”? Efeitos na saúde: Dias livre de sintomas Anos de vida ganho Eventos evitados Pacientes Provedores Sociedade Pagadores Utilities: QALYs: quality-adjusted life-years DALYs: disability-adjusted life-years • There is a multiplicity of outputs and outcomes resulting from healthcare interventions. They can be physiological measures such as changes in blood pressure or cholesterol levels, or specific clinical events such as myocardial infarctions or stokes prevented. These outcomes can be difficult to measure and compare. • Attempts have been made to move towards ‘common currencies’ that enable comparisons across disease categories by considering the impact of interventions on survival – expressed as life-years gained. However, the use of life-years as a common currency discriminates against chronic diseases where interventions are designed to impact more on quality of life rather than on life expectancy.1,2 • Thus considerable work has been undertaken on the development of utility measures (instruments and techniques to assess health status) that can be used as a common currency enabling interventions in a wide range of disease areas to be compared. One example is quality-adjusted life-years (QALYs).1–3 • A QALY takes into account both quantity and the quality of life generated by healthcare interventions. It is the arithmetic product of life expectancy and a measure of the quality of the remaining life years.3 References: 1. Drummond MF, O’Brien B, Stoddart GL, Torrance GW. Methods for the economic evaluation of health care programmes. Oxford: Oxford University Press, 1997. 2. Kobelt G. Health economics: an introduction to economic evaluation. London: OHE, 2002. 3. Phillips CJ, Thompson G. What is a QALY? London: Hayward Medical Communications, 1998. Base científica consistente
 that can be used as a common currency enabling interventions in a wide range of disease areas to be compared. One example is quality-adjusted life-years (QALYs).1–3. • A QALY takes into account both quantity and the quality of life generated by healthcare interventions. It is the arithmetic product of life expectancy and a measure of the quality of the remaining life years.3. References: 1. Drummond MF, O’Brien B, Stoddart GL, Torrance GW. Methods for the economic evaluation of health care programmes. Oxford: Oxford University Press, Kobelt G. Health economics: an introduction to economic evaluation. London: OHE, Phillips CJ, Thompson G. What is a QALY London: Hayward Medical Communications, Base científica consistente.")
21
Quality-Adjusted Life Year (QALY)
(AVAQ – Anos de Vida Ajustados pela Qualidade) Unidade de medida que associa duração e qualidade de vida de um paciente ou uma população QALY anos
 Unidade de medida que associa duração e qualidade de vida de um paciente ou uma população. QALY. anos.")
22
Quality-Adjusted Life Year (QALY)
(AVAQ – Anos de Vida Ajustados pela Qualidade)
")
23
Quality-Adjusted Life Year (QALY)
(AVAQ – Anos de Vida Ajustados pela Qualidade) 1 QALY = 1 ano de vida vivido com plena qualidade
 1 QALY = 1 ano de vida vivido com plena qualidade.")
24
Modelo de Markov Sobrevida Sem doença Tratamento Morte Recorrência
Drummond MF, O’Brien B, Stoddart GL, Torrance GW. Methods for the Economic Evaluation of Health Care Programmes. Oxford: Oxford University Press 1997:242-3.

25
Drummond MF, O’Brien B, Stoddart GL, Torrance GW
Drummond MF, O’Brien B, Stoddart GL, Torrance GW. Methods for the Economic Evaluation of Health Care Programmes. Oxford: Oxford University Press 1997:242-3.

26
Definição de “custo-efetivo”
País Definição EUA US$ United Kingdon (NICE) US$ Brasil ?
 US$ Brasil.")
27
Custo por Ano de Vida Ganho
Tratamento Custo por ano de vida ganho (U$) Recomendar abandonar tabagismo 1300 – 3900 Betabloqueadores em cardiopata isquêmico 5900 Estatinas 9800 Coquetel antiviral para HIV Betabloqueadores pos IAM 20200 Air Bag para acento ao lado do motorista 27000 Diálise 50000 Mamografia anual pacientes < 45 anos 110000 Ergometria em homen 40 anos assintomatico 124000 Inibidores de Cox2 para prevenir sangramento digestivo por úlcera 185000 This slide shows the cost per year of life gained (in US$) according to the different treatments1,2,3,4. Costs are high because physicians often have to treat scores of patients for years with expensive therapies to save one year of one person’s life. The table reveals that there is an enormous variation in the cost of saving one year of life and these differences exist in both within and between categories. Such a result is important because efficiency in promoting survival requires that the marginal benefit per dollar spent be the same across programs. Where there are investment inequalities, more lives could be saved by shifting resources. References: J Probstfield, Am J Cardiol 2003: 91 (suppl): 22G-27G Johannesson et al. N Engl J Med 1997; 336: (Tables, US price) T O Tengs, Risk Analysis 1995: 15, 3, Goldman L et al. N Engl J Med 1988; 319: Source: J Probstfield, Am J Cardiol 2003: 91 (suppl): 22G – 27G Johannesson et al. N Engl J Med 1997; 336: 332–336; T O Tengs, Risk Analysis 1995: 15, 3, ; Goldman L et al. N Engl J Med 1988; 319:
 Recomendar abandonar tabagismo – Betabloqueadores em cardiopata isquêmico Estatinas Coquetel antiviral para HIV Betabloqueadores pos IAM Air Bag para acento ao lado do motorista Diálise Mamografia anual pacientes < 45 anos Ergometria em homen 40 anos assintomatico Inibidores de Cox2 para prevenir sangramento digestivo por úlcera This slide shows the cost per year of life gained (in US$) according to the different treatments1,2,3,4. Costs are high because physicians often have to treat scores of patients for years with expensive therapies to save one year of one person’s life. The table reveals that there is an enormous variation in the cost of saving one year of life and these differences exist in both within and between categories. Such a result is important because efficiency in promoting survival requires that the marginal benefit per dollar spent be the same across programs. Where there are investment inequalities, more lives could be saved by shifting resources. References: J Probstfield, Am J Cardiol 2003: 91 (suppl): 22G-27G. Johannesson et al. N Engl J Med 1997; 336: (Tables, US price) T O Tengs, Risk Analysis 1995: 15, 3, Goldman L et al. N Engl J Med 1988; 319: Source: J Probstfield, Am J Cardiol 2003: 91 (suppl): 22G – 27G Johannesson et al. N Engl J Med 1997; 336: 332–336; T O Tengs, Risk Analysis 1995: 15, 3, ; Goldman L et al. N Engl J Med 1988; 319:")
28
Custo por Ano de Vida Ganho
Tratamento Custo por ano de vida ganho (U$) Recomendar abandonar tabagismo 1300 – 3900 Betabloqueadores em cardiopata isquêmico 5900 Estatinas 9800 Coquetel antiviral para HIV Betabloqueadores pos IAM 20200 Air Bag para acento ao lado do motorista 27000 Diálise 50000 Mamografia anual pacientes < 45 anos 110000 Ergometria em homen 40 anos assintomatico 124000 Inibidores de Cox2 para prevenir sangramento digestivo por úlcera 185000 This slide shows the cost per year of life gained (in US$) according to the different treatments1,2,3,4. Costs are high because physicians often have to treat scores of patients for years with expensive therapies to save one year of one person’s life. The table reveals that there is an enormous variation in the cost of saving one year of life and these differences exist in both within and between categories. Such a result is important because efficiency in promoting survival requires that the marginal benefit per dollar spent be the same across programs. Where there are investment inequalities, more lives could be saved by shifting resources. References: J Probstfield, Am J Cardiol 2003: 91 (suppl): 22G-27G Johannesson et al. N Engl J Med 1997; 336: (Tables, US price) T O Tengs, Risk Analysis 1995: 15, 3, Goldman L et al. N Engl J Med 1988; 319: Source: J Probstfield, Am J Cardiol 2003: 91 (suppl): 22G – 27G Johannesson et al. N Engl J Med 1997; 336: 332–336; T O Tengs, Risk Analysis 1995: 15, 3, ; Goldman L et al. N Engl J Med 1988; 319:
 Recomendar abandonar tabagismo – Betabloqueadores em cardiopata isquêmico Estatinas Coquetel antiviral para HIV Betabloqueadores pos IAM Air Bag para acento ao lado do motorista Diálise Mamografia anual pacientes < 45 anos Ergometria em homen 40 anos assintomatico Inibidores de Cox2 para prevenir sangramento digestivo por úlcera This slide shows the cost per year of life gained (in US$) according to the different treatments1,2,3,4. Costs are high because physicians often have to treat scores of patients for years with expensive therapies to save one year of one person’s life. The table reveals that there is an enormous variation in the cost of saving one year of life and these differences exist in both within and between categories. Such a result is important because efficiency in promoting survival requires that the marginal benefit per dollar spent be the same across programs. Where there are investment inequalities, more lives could be saved by shifting resources. References: J Probstfield, Am J Cardiol 2003: 91 (suppl): 22G-27G. Johannesson et al. N Engl J Med 1997; 336: (Tables, US price) T O Tengs, Risk Analysis 1995: 15, 3, Goldman L et al. N Engl J Med 1988; 319: Source: J Probstfield, Am J Cardiol 2003: 91 (suppl): 22G – 27G Johannesson et al. N Engl J Med 1997; 336: 332–336; T O Tengs, Risk Analysis 1995: 15, 3, ; Goldman L et al. N Engl J Med 1988; 319:")
29
Definição de “custo-efetivo”
The World Health Organisation (WHO) defines the threshold for cost-effectiveness as being less than 3X the gross domestic product (GDP) per head Cost effective Interventions that gain each year of healthy life (e.g. disability adjusted life year [DALY] averted) at a cost less than GDP per head (i.e. less than US$ 30,000 per head) are defined as very cost effective Interventions averting each DALY at a cost between one and three times GDP per head (US$ 30,000 – US$ 90,000) are defined as cost-effective Not cost effective The remainder (>US$90,000 per QALY) is defined as not cost-effective In absolute terms, as you will see in subsequent slides, whatever the indication considered, clopidogrel meets the threshold for cost-effectiveness recently defined by the World Health Organisation (WHO) Commission on Macroeconomics and Health (CMH), which is a cost-effectiveness ratio of less than three times the gross domestic product (GDP) per head1. Interventions that gain each year of healthy life (e.g. disability adjusted life year [DALY] averted) at a cost less than GDP per head (i.e. less than US$ 30,000 per head) are defined as very cost effective; those averting each DALY at a cost between one and three times GDP per head (US$ 30,000 – US$ 90,000) as cost-effective; and the remainder (>US$90,000 per QALY) as not cost-effective References: WHO Commission. Macroeconomics and health: investing in health for economic development. Report of the Commission on macroeconomics and Health. Geneva: World Health Organization; 2001 WHO Commission. Macroeconomics and health: investing in health for economic development.. Report of the Commission on macroeconomics and Health. Geneva: World Health Organization; 2001
 defines the threshold for cost-effectiveness as being less than 3X the gross domestic product (GDP) per head. Cost effective. Interventions that gain each year of healthy life (e.g. disability adjusted life year [DALY] averted) at a cost less than GDP per head (i.e. less than US$ 30,000 per head) are defined as very cost effective. Interventions averting each DALY at a cost between one and three times GDP per head (US$ 30,000 – US$ 90,000) are defined as cost-effective. Not cost effective. The remainder (>US$90,000 per QALY) is defined as not cost-effective. In absolute terms, as you will see in subsequent slides, whatever the indication considered, clopidogrel meets the threshold for cost-effectiveness recently defined by the World Health Organisation (WHO) Commission on Macroeconomics and Health (CMH), which is a cost-effectiveness ratio of less than three times the gross domestic product (GDP) per head1. Interventions that gain each year of healthy life (e.g. disability adjusted life year [DALY] averted) at a cost less than GDP per head (i.e. less than US$ 30,000 per head) are defined as very cost effective; those averting each DALY at a cost between one and three times GDP per head (US$ 30,000 – US$ 90,000) as cost-effective; and the remainder (>US$90,000 per QALY) as not cost-effective. References: WHO Commission. Macroeconomics and health: investing in health for economic development. Report of the Commission on macroeconomics and Health. Geneva: World Health Organization; WHO Commission. Macroeconomics and health: investing in health for economic development.. Report of the Commission on macroeconomics and Health. Geneva: World Health Organization;")
30
Definição de “custo-efetivo”
In absolute terms, as you will see in subsequent slides, whatever the indication considered, clopidogrel meets the threshold for cost-effectiveness recently defined by the World Health Organisation (WHO) Commission on Macroeconomics and Health (CMH), which is a cost-effectiveness ratio of less than three times the gross domestic product (GDP) per head1. Interventions that gain each year of healthy life (e.g. disability adjusted life year [DALY] averted) at a cost less than GDP per head (i.e. less than US$ 30,000 per head) are defined as very cost effective; those averting each DALY at a cost between one and three times GDP per head (US$ 30,000 – US$ 90,000) as cost-effective; and the remainder (>US$90,000 per QALY) as not cost-effective References: WHO Commission. Macroeconomics and health: investing in health for economic development. Report of the Commission on macroeconomics and Health. Geneva: World Health Organization; 2001
 Commission on Macroeconomics and Health (CMH), which is a cost-effectiveness ratio of less than three times the gross domestic product (GDP) per head1. Interventions that gain each year of healthy life (e.g. disability adjusted life year [DALY] averted) at a cost less than GDP per head (i.e. less than US$ 30,000 per head) are defined as very cost effective; those averting each DALY at a cost between one and three times GDP per head (US$ 30,000 – US$ 90,000) as cost-effective; and the remainder (>US$90,000 per QALY) as not cost-effective. References: WHO Commission. Macroeconomics and health: investing in health for economic development. Report of the Commission on macroeconomics and Health. Geneva: World Health Organization;")
32
6 razões para análise diferente
Muitos dispositivos são diagnósticos e não terapêuticos Inviabilidade de RCTs Dependem de “como é usado” Interferência do ambiente, como local de uso Comparativos não disponíveis Oscilação de preços varia mais do que drogas

33
Quanto vale a vida de um brasileiro?
Valor ético: infinito Valor atribuído para buscar equidade de acesso: sociedade brasileira deve decidir

34
E o futuro?

37
Preço baseada em Valor (VBP) Lista de Custo Efetividade Incremental
 Lista de Custo Efetividade Incremental")
38
Publicada no DOU do dia 29/abril/2011, que altera a Lei no 8
Publicada no DOU do dia 29/abril/2011, que altera a Lei no 8.080, de 19 de setembro de 1990, para dispor sobre a assistência terapêutica e a incorporação de tecnologia em saúde no âmbito do SUS

39
In. Avaliação de tecnologias em saúde, Artmed, 2009

46
”O maior risco nos tempos de turbulência não é a turbulência em si; é agir com a lógica de ontem.”
Peter Drucker

47
Obrigado pela atenção! stephenstefani@terra.com.br

48
Currículo completo: http://lattes.cnpq.br/2215209375519900
Formado em Medicina pela UFRGS (1994) com residência médica no Hospital de Clínicas de Porto Alegre (HCPA) em Clínica Médica ( ) e Cancerologia ( ). Estágios na Oncology Division da University of California / Stanford (1997). Especialização em Auditoria Médica pela Universidade Costa Gama (2001). Coordenador da Auditoria Médica da UNIMED Porto Alegre ( ). Coordenador da Câmara Técnica de Oncologia da UNIMED do Brasil (desde 2004). Professor da pós Graduação, com foco em Economia da Saúde, da Universidade de Ribeirão Preto (URP) e Universidade Federal do Ceará (UFC) e do Instituto de Administração Hospitalar e Ciências da Saúde (IAHCS). Professor de Oncologia e Farmacoeconomia da Fundação UNIMED. Publicou mais de 60 trabalhos e capítulos de livros no país e exterior, incluindo o livro Clínica Médica, com mais de 30 mil exemplares vendidos no Brasil e Portugal. Tem mais de 100 palestras em congressos médicos, inclusive nos EUA, Argentina, Colômbia, Portugal, Suíça e Canadá. Traduziu e participou da revisão técnica de 6 dos principais livros de gestão médica disponíveis no país. Atua como Consultor e Auditor de mais de 70 operadoras de planos de saúde no país. Coordena o Programa de Medicamento Oncológico da Capesesp, auto-gestão da Fundação Nacional de Saúde, ligada ao Ministério da Saúde. Membro efetivo de várias sociedades médicas, incluindo American College of Physicians (ACP), International Association for the Studu of Lung Cancer (IASLC) e American Society of Clinical Oncology (ASCO). Presidente do capítulo Brasil da International Society of Pharmacoeconomics and Outcome Research (ISPOR). Membro do Comitê Executivo da ISPOR América Latina. Currículo completo:
 com residência médica no Hospital de Clínicas de Porto Alegre (HCPA) em Clínica Médica ( ) e Cancerologia ( ). Estágios na Oncology Division da University of California / Stanford (1997). Especialização em Auditoria Médica pela Universidade Costa Gama (2001). Coordenador da Auditoria Médica da UNIMED Porto Alegre ( ). Coordenador da Câmara Técnica de Oncologia da UNIMED do Brasil (desde 2004). Professor da pós Graduação, com foco em Economia da Saúde, da Universidade de Ribeirão Preto (URP) e Universidade Federal do Ceará (UFC) e do Instituto de Administração Hospitalar e Ciências da Saúde (IAHCS). Professor de Oncologia e Farmacoeconomia da Fundação UNIMED. Publicou mais de 60 trabalhos e capítulos de livros no país e exterior, incluindo o livro Clínica Médica, com mais de 30 mil exemplares vendidos no Brasil e Portugal. Tem mais de 100 palestras em congressos médicos, inclusive nos EUA, Argentina, Colômbia, Portugal, Suíça e Canadá. Traduziu e participou da revisão técnica de 6 dos principais livros de gestão médica disponíveis no país. Atua como Consultor e Auditor de mais de 70 operadoras de planos de saúde no país. Coordena o Programa de Medicamento Oncológico da Capesesp, auto-gestão da Fundação Nacional de Saúde, ligada ao Ministério da Saúde. Membro efetivo de várias sociedades médicas, incluindo American College of Physicians (ACP), International Association for the Studu of Lung Cancer (IASLC) e American Society of Clinical Oncology (ASCO). Presidente do capítulo Brasil da International Society of Pharmacoeconomics and Outcome Research (ISPOR). Membro do Comitê Executivo da ISPOR América Latina. Currículo completo:")
Apresentações semelhantes


>")
