Carregar apresentação
1
12 March 2009

2
Inserção da Doença Renal Crônica na Atenção Primária
Patrícia Ferreira Abreu Secretaria Geral da Sociedade Brasileira de Nefrologia Patrícia Ferreira Abreu – UNIFESP

3
POR QUE QUEM COMO Patrícia Ferreira Abreu – UNIFESP
Secretaria Geral da Sociedade Brasileira de Nefrologia Patrícia Ferreira Abreu – UNIFESP

4
Critérios para uma doença ser considerada um problema de saúde pública
Doença com grande impacto no sistema de saúde Acomete muitas pessoas Vem aumentando nos últimos anos Provavelmente continuará a aumentar Experimentada em termos de mortalidade/morbidade, qualidade de vida e custo Percebida como uma ameaça ou fora de controle Distribuição irregular Evidências de que estratégias de prevenção podem reduzir o fardo Evidências de que estratégias preventivas ainda não estão sendo implementadas

5
Obstruções- cálculos, tumores
ETIOLOGIAS HIPERTENSÃO DIABETES Obstruções- cálculos, tumores Rins Policísticos NEFRITES OUTRAS: Lupus, rejeição crônica do transplante, ITU repetição Alexander Tsiaras: The Invision Guide to Lifeblood Chronic Kidney Disease and Anemia

7
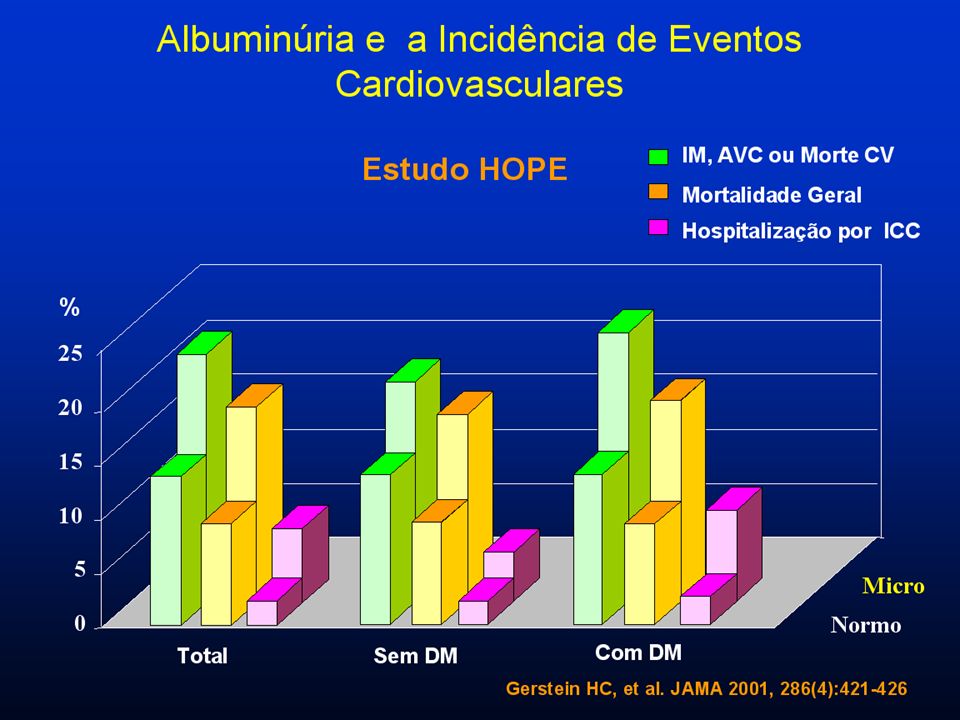
KDOQI-NKF, AJKD. 2002;39(Suppl 1) & Ann Intern Med 2007
PREVALÊNCIA DA DRC DE ACORDO COM A FG 5,7% 5,4% 0,4% NHANES ( ) NHANES (88-94) FG (mL/min/1,73 m2) ESTÁGIOS 1 90 3,3% 3,0% 2 60-89 4,3% 3 30-59 0,3% 4 & 5 <29 KDOQI-NKF, AJKD. 2002;39(Suppl 1) & Ann Intern Med 2007
 NHANES. (88-94) FG. (mL/min/1,73 m2) ESTÁGIOS. 1. 90. 3,3% 3,0% ,3% ,3% 4 & 5. <29. KDOQI-NKF, AJKD. 2002;39(Suppl 1) & Ann Intern Med")
8
DOENÇA RENAL CRÔNICA NO BRASIL
ESTÁGIOS IV + V III II I

9
Controle da pressão arterial Controle da glicemia
TRS Estágio 5 ClCr < 15 Idem TRS Estágio 4 ClCr Idem Anemia, doença óssea, acidose Contraste, correção drogas Estágio 3 ClCr Controle da pressão arterial, da glicemia, dislipidemia, peso, tabagismo, sal, AINH Estágio 2 ClCr Controle da pressão arterial, da glicemia, dislipidemia, peso, tabagismo, sal, AINH MICROALBUMINÚRIA - PROTEINÚRIA Estágio 1 ClCr ≥ 90 Controle da pressão arterial Controle da glicemia Dislipidemia, peso, tabagismo, sal, AINH Estágio zero Grupo de risco

10
< 125 x 75 mmHg (se proteinúria)
Recomendações Pressão Arterial < 130 x 85 mmHg < 125 x 75 mmHg (se proteinúria) Glicemia: < 110 mg/dl Hemoglobina glicada: < 7% Albuminúria < 30 mg em 24 horas 4. Sal < 5,0 g 5. Não fumar 6. Colesterol < 200 mg/dL LDL < 100 mg/dL Triglicérides < 150 mg/dL 7. IMC
 Glicemia: < 110 mg/dl. Hemoglobina glicada: < 7% Albuminúria < 30 mg em 24 horas. 4. Sal < 5,0 g. 5. Não fumar. 6. Colesterol < 200 mg/dL. LDL < 100 mg/dL. Triglicérides < 150 mg/dL. 7. IMC")
13
Controle e eventos no diabetes
Stroke Any Diabetic Endpoint DM Deaths Microvascular Complications 5% 10% -10 12% -20 24% * % Reduction In Relative Risk -30 32% 32% Diabetes: Tight Glucose vs Tight BP Control and CV Outcomes in UKPDS A comparison of tight glucose control, HbA1c=7% (achieved was 8.2%) vs tight blood pressure control <150/85 mmHg (achieved 144/82 mmHg) revealed that blood pressure reduction contributed to a greater extent to the relative reduction of cardiovascular events. References: Tight blood pressure control and risk of macrovascular and microvascular complications in type 2 diabetes: UKPDS 38. UK Prospective Diabetes Study Group. BMJ. 1998;317(7160): Efficacy of atenolol and captopril in reducing risk of macrovascular and microvascular complications in type 2 diabetes: UKPDS 39. UK Prospective Diabetes Study Group. BMJ. 1998;317(7160): * 37% *P <0.05 compared to tight glucose control * -40 44% Tight Glucose Control (Goal <6.0 mmol/l or 108 mg/dL) Tight BP Control (Average 144/82 mmHg) * -50 Bakris GL, et al. Am J Kidney Dis. 2000;36(3):
 vs tight blood pressure control <150/85 mmHg (achieved 144/82 mmHg) revealed that blood pressure reduction contributed to a greater extent to the relative reduction of cardiovascular events. References: Tight blood pressure control and risk of macrovascular and microvascular complications in type 2 diabetes: UKPDS 38. UK Prospective Diabetes Study Group. BMJ. 1998;317(7160): Efficacy of atenolol and captopril in reducing risk of macrovascular and microvascular complications in type 2 diabetes: UKPDS 39. UK Prospective Diabetes Study Group. BMJ. 1998;317(7160): * 37% *P <0.05 compared to tight glucose control. * % Tight Glucose Control. (Goal <6.0 mmol/l or 108 mg/dL) Tight BP Control. (Average 144/82 mmHg) * -50. Bakris GL, et al. Am J Kidney Dis. 2000;36(3):")
14
Inibidor de ECA em diabéticos normotensos - proteinúria
% with doubling of baseline creatinine 100 75 50 25 1 2 3 4 Baseline creatinine >1.5 mg/dL Captopril n=207 Placebo n=202 P<.001 Years of follow-up ACE-I Is More Renoprotective Than Conventional Therapy in Type 1 Diabetes In this landmark trial by Lewis et al, the study design was a randomized, controlled trial in patients with type 1 diabetes who were treated with captopril (n=207) or placebo (n=202). Those assigned to captopril received 25 mg tid, and those assigned to the control group received placebo tid. Entry criteria included urinary protein excretion of >500 mg/day and serum creatinine <2.5 mg/dL. Blood-pressure goals were defined to achieve control during a median follow-up of three years. The recommended dietary protein intake was 1 g/kg of body weight per day. The primary end point was a doubling of the base-line serum creatinine concentration. As shown, the number of patients who experienced a doubling of baseline serum creatinine was reduced significantly (p<0.001) with captopril. Reference: Lewis EJ, Hunsicker LG, Bain RP, Rohde RD. The effect of angiotensin-converting-enzyme inhibition on diabetic nephropathy. The Collaborative Study Group. N Engl J Med. 1993;329(20): Lewis EJ, et al. N Engl J Med. 1993;329(20):
 or placebo (n=202). Those assigned to captopril received 25 mg tid, and those assigned to the control group received placebo tid. Entry criteria included urinary protein excretion of >500 mg/day and serum creatinine <2.5 mg/dL. Blood-pressure goals were defined to achieve control during a median follow-up of three years. The recommended dietary protein intake was 1 g/kg of body weight per day. The primary end point was a doubling of the base-line serum creatinine concentration. As shown, the number of patients who experienced a doubling of baseline serum creatinine was reduced significantly (p<0.001) with captopril. Reference: Lewis EJ, Hunsicker LG, Bain RP, Rohde RD. The effect of angiotensin-converting-enzyme inhibition on diabetic nephropathy. The Collaborative Study Group. N Engl J Med. 1993;329(20): Lewis EJ, et al. N Engl J Med. 1993;329(20):")
15
QUEM IRÁ DIAGNOSTICAR? O NEFROLOGISTA?

16
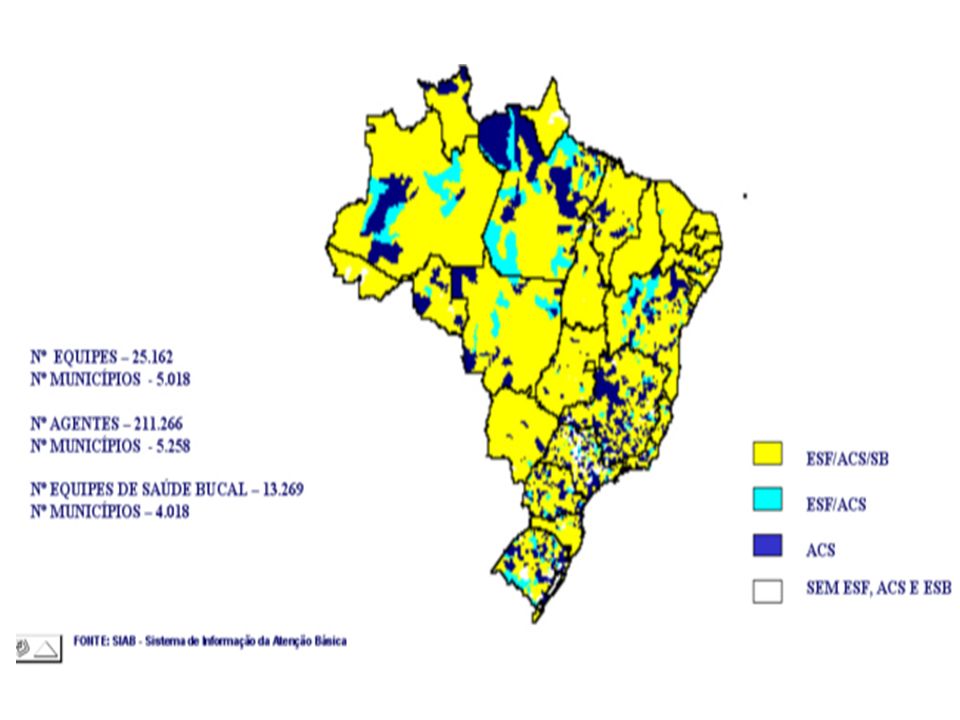
IBGE-Municípios por número de habitantes-2007
Brasil - dimensão continental e desigualdades População brasileira: IBGE-09/03/2009 : habitantes Área: ,3 km² População usuária do SUS-75% (99,1% a 66%) : IBGE-Municípios por número de habitantes-2007 Total Até hab 5.001 a hab a hab a hab Mais de hab
 : IBGE-Municípios por número de habitantes Total Até hab a hab a hab a hab Mais de hab. 36.")
17
2006 Distribuídos em 315 municípios

18
brasileiros 5.564 municípios: habitantes no Ceará 16,5% = habitantes em Fortaleza 16,5% =

20
COMO DIAGNOSTICAR?

21
Programas incentivados pelo Governo Federal (PAB ampliado)
E a Doença Renal? CADÊ? Imunizações DST/AIDS Hanseníase Tuberculose Hipertensão Arterial Diabetes Asma

22
Alteração no sedimento urinário

23
COLETA Urina de 24 horas Proteinúria: >150 mg
Microalbuminúria: 30 – 300 mg Amostra isolada de urina corrigir pela creatinina urinária -Proteinúria: > 200 mg/g creatU -Microalbuminúria: 30 – 300 mg/g creatU

24
Ritmo de Filtração Glomerular
Clearance de Creatinina = Depuração Clear Cr (ml/min) = Cr urinária x volume U Cr plasmática Clearance de Creatinina Estimado (fórmula de Cockcroft-Gault): Clear Cr (ml/min)=(140 – idade) x peso * Cr plasmática x 72 * mulheres x 0,85
 = Cr urinária x volume U. Cr plasmática. Clearance de Creatinina Estimado (fórmula de Cockcroft-Gault): Clear Cr (ml/min)=(140 – idade) x peso * Cr plasmática x 72. * mulheres x 0,85.")
25
Sexo feminino Estágios da DRC: 1 2 3 4 5 Creatinina (mg/dL)
Idade (anos) Filtração glomerular (mL/min/1,73 m2) Estágios da DRC: Rita M.R. Bastos e Marcus G. Bastos (JBN, 2005)
 Filtração glomerular (mL/min/1,73 m2) Estágios da DRC: Rita M.R. Bastos e Marcus G. Bastos (JBN, 2005)")
28
Risco de Doença Renal Crônica – DRC
Diagnóstico de DRC: 1-Identificação dos Grupos de risco Diabetes Mellitus Hipertensão Arterial História Familiar de DRC > Grupo de risco > 2-Presença de alterações do sedimento urinário (microalbuminúria, proteinúria) Exame de urina tipo 1 + Proteína - Proteinúria microalbuminúria 3-Diminuição do clearance de creatinina (utilizar a fórmula de Cockcroft-Gault, a partir da creatinina sérica) Clcr ml/min = (140 – idade) x peso x (0,85 se mulher) 72 x creatinina sérica mg/dL
 Exame de urina tipo 1. + Proteína - Proteinúria microalbuminúria. 3-Diminuição do clearance de creatinina (utilizar a fórmula de Cockcroft-Gault, a partir da creatinina sérica) Clcr ml/min = (140 – idade) x peso x (0,85 se mulher) 72 x creatinina sérica mg/dL.")
29
Caso clínico 1 Mulher, 55 anos, diabética tipo 2, pressão arterial, glicemia e urina tipo 1 normais. ( ) retorno anual ( ) repetir exame de urina ( ) microalbuminúria amostra isolada ( X) microalbuminúria de 24 horas Obs: amostra isolada corrigida pela creatU
 retorno anual. ( ) repetir exame de urina. ( ) microalbuminúria amostra isolada. ( X) microalbuminúria de 24 horas. Obs: amostra isolada corrigida pela creatU.")
30
Caso clínico 2 Mulher, 20 anos, assintomática, peso 60 kg, pressão arterial, glicemia e urina tipo 1 normais, creatinina 0,7. Depuração de creatinina? (X) 121 ml/min ( ) 100 ml/min ( ) 95 ml/min ( ) 90 ml/min
 121 ml/min. ( ) 100 ml/min. ( ) 95 ml/min. ( ) 90 ml/min.")
31
Caso clínico 3 Mulher, 75 anos, assintomática, peso 62 kg, pressão arterial, glicemia e urina tipo 1 normais, creatinina 0,8. Depuração de creatinina? ( ) 100 ml/min ( ) 90 ml/min ( ) 70 ml/min (X) 60 ml/min
 100 ml/min. ( ) 90 ml/min. ( ) 70 ml/min. (X) 60 ml/min.")
32
< 125 x 75 mmHg (se proteinúria)
Recomendações Pressão Arterial < 130 x 85 mmHg < 125 x 75 mmHg (se proteinúria) Glicemia: < 110 mg/dl Hemoglobina glicada: < 7% Albuminúria < 30 mg em 24 horas 4. Sal < 5,0 g 5. Não fumar 6. Colesterol < 200 mg/dL LDL < 100 mg/dL Triglicérides < 150 mg/dL 7. IMC
 Glicemia: < 110 mg/dl. Hemoglobina glicada: < 7% Albuminúria < 30 mg em 24 horas. 4. Sal < 5,0 g. 5. Não fumar. 6. Colesterol < 200 mg/dL. LDL < 100 mg/dL. Triglicérides < 150 mg/dL. 7. IMC")
33
ESTÁGIOS 549 235 (42,8%) 107 106 68 33 Centro Estadual para Tratamento de Doenças Renais do Vale do Paraíba

34
CAUSAS DA DRC 546 263 (48,1%) 170 (31,1%) 79 (14,4%) 26 8
 170 (31,1%) 79 (14,4%) 26 8")
35
COMPARAÇÕES ADMISSÃO X ATUAL
% PACIENTES NO ALVO* GLICEMIA Mg/dl 147 (n 78) 111 (n 268) 35% x 49,6% p0,002 COLESTEROL TOTAL 197 (n 145) 185,3 (n 549) 55% x 64,8% p0,03 TRIGLICERIDES 166,3 (n 140) 154,5 (n549) 59% x 63% p0,034 PA SISTÓLICA mmHg 173 (n 376) 142 (n 544) 22% x 62% p0,0001 PA DIASTÓLICA 105 85,3 33% x 75,5% * ALVOS : Glicemia < 120; Colesterol Total < 200; Triglicerideos < 150; PAS < 140; PAD < 90
 111. (n 268) 35% x 49,6% p0,002. COLESTEROL TOTAL (n 145) 185,3. (n 549) 55% x 64,8% p0,03. TRIGLICERIDES. 166,3. (n 140) 154,5. (n549) 59% x 63% p0,034. PA SISTÓLICA. mmHg (n 376) 142. (n 544) 22% x 62% p0,0001. PA DIASTÓLICA ,3. 33% x 75,5% * ALVOS : Glicemia < 120; Colesterol Total < 200; Triglicerideos < 150; PAS < 140; PAD < 90.")
36
ADMISSÃO ATUAL GLICEMIA MÉDIA 147 111 27% 44,7%
COMPARAÇÕES ADMISSÃO X ATUAL DIABÉTICOS ADMISSÃO ATUAL n=268 GLICEMIA MÉDIA MEDIANA DESVIO PADRÃO MÁXIMA MÍNIMO 147 130 63,8 544 55 111 99 57 508 54 USO DE INSULINA (%) 27% 44,7% ESTÁGIO 4 (USO INSULINA) 60% 87,7% GLICEMIA < 120 mg/dl 35% 49,6%
 27% 44,7% ESTÁGIO 4 (USO INSULINA) 60% 87,7% GLICEMIA < 120 mg/dl. 35% 49,6%")
37
Para Terapia de Substituição Renal
ABORDAGEM DA DRC 1º Nível de Atenção PREPARAR Para Terapia de Substituição Renal RETARDAR DRC PREVENIR DETECÇÃO PRECOCE INICIAR Terapia de Substituição Renal CONTROLAR Terapia de Substituição Renal 2° Nível de Atenção


 – Lápides 1, 2, 3» «nomes gravados, 21 de Agosto de 2008» «Ultramar.TerraWeb»>")


>")